Long-term wealth creation can be achieved through disciplined adherence to a well-crafted plan. But in the words of Mike Tyson, “everybody has a plan until they get punched in the mouth.” When the market falls, “staying the course” can be especially difficult. Tucked inside our subconscious remain traits and biases developed over thousands of years to help us survive and endure as hunters and gatherers, but these survival traits and biases are less useful in today’s modern world. In fact, they can impede us from making reasonable decisions about everything from what to eat to how to invest. Understanding these biases and considering whether they may be negatively impacting decisions can be beneficial when implementing long-term investment plans.
The more often an investor counts his money — or looks at the value of his mutual funds in the newspaper — the lower his risk tolerance.
— Richard Thaler, Ph.D.
Understanding Your Risk Tolerance
People, in general, have asymmetric risk profiles. Empirical research indicates that the fear of losses looms larger than their expectation of gains by at least a 2:1 margin.1 Yet this inherent loss avoidance survival trait stands in stark contrast to a basic investment principal: that one may need to accept the higher risk (and higher potential for near-term losses) in order to achieve higher returns over the long term.
When faced with losses, perspective and rational decision-making may become diminished by our emotional desire to avoid more losses. Furthermore, the urge to sell when the market is down can be reinforced by a corresponding preponderance of negative financial news stories that seem to confirm one’s fears (i.e. confirmation bias) and give added impetus to sell. It can be a powerful combination and difficult to challenge in the midst of a market swoon.
Long-Term Investment Horizon
A University of Chicago study examined how a simple change to the display of retirement fund performance impacted investor asset allocation decisions.2 In 2010 the regulator of Israel’s long-term savings market prohibited the display of fund returns for periods of less than 12 months (though shorter-term performance could easily be determined with the data given). Before that change, one-month returns were displayed prominently. Since the market historically tends to trend upward over longer periods of time, negative monthly returns were more frequent than negative annual returns. Before the policy change, investors were more likely to sell risky assets when the monthly returns were negative. Over time, that led to a more conservative investment profile. After the change, overall trading volume decreased by 30 percent. The resulting increased exposure to more risky assets served to benefit investors with long-term investment horizons.
Due to the effects of compounding, exiting the market, even for short periods of time, can be detrimental to longer-term wealth creation. Consider if one were to miss the 10 best days in the most recent bull market cycle. Exhibit 1 illustrates the hypothetical total return on $10,000 invested in the S&P 500 index starting from the 2009 market bottom through December 2019. One would have accumulated an additional $49, 848 using a buy and hold strategy versus just $28,393 after missing the 10 best days. The worst and best days in the market often tend to occur fairly close together, further increasing the risk that sell decisions prompted by market declines can leave an investor out of the market when the best days follow.
1Source: Econometrica, “Prospect Theory: An Analysis of Decision under Risk,” March 1979.
2Source: Shaton, “The Display of Information and Household Investment Behavior,” Nov. 20, 2014.
Exhibit 1: Hypothetical Growth of the S&P 500 Index
Based on Hypothetical $10,000 Original Investment
(March 9, 2009 - December 31, 2019)
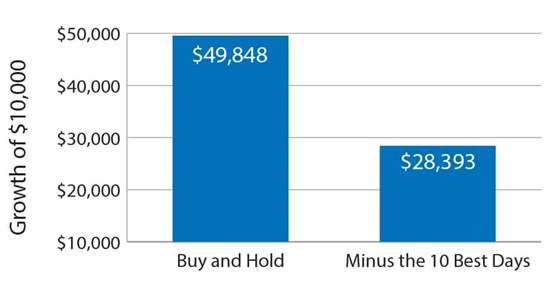
Source: Bloomberg, S&P Dow Jones Indexes
Performance data quoted represents past performance, which is no guarantee of future results. The investment return and principal value of an investment will fluctuate so that an investor’s shares, when redeemed, may be worth more or less than their original cost. Current performance may be higher or lower than performance data given. The hypothetical results of the index illustrated do not include the effects of any additional applicable charges which would lower returns.
1Source: Econometrica, “Prospect Theory: An Analysis of Decision under Risk,” March 1979.
2Source: Shaton, “The Display of Information and Household Investment Behavior,” Nov. 20, 2014.
As of 12/31/2019, the performance of the S&P 500 Index was 31.49% for one year, 15.26% for three years, 11.69% for five years and 13.39% for ten years.
If you have an individual whose objective is to maximize wealth at a certain future point in time, then loss aversion is very bad because loss aversion will cause that individual to miss out on many opportunities.
— Daniel Kahneman, Ph.D.
How Behavioral Bias Impacts Investment Decisions
Touchstone’s analysis suggests that over the next three to five years U.S. equities will likely deliver mid-single digit total returns and experience increased volatility. Such a scenario could certainly trigger investor loss aversion and allocation shifts to cash and bonds (with less return potential). Given this backdrop, we believe it is important to be alert to emotions and to understand the value of remaining invested for the long term. Seeking to help smooth the ride in equities and quiet nerves, Touchstone believes in adopting a more conservative approach to investing. In addition, given prevailing higher market valuations and lower return assumptions, we believe it is prudent to consider a more targeted (i.e. actively managed) approach to identifying individual stock opportunities within the market.
The information provided represents Touchstone’s views and observations regarding past and current market conditions and investor behaviors. The information and statements provided herein are believed to be true and accurate. There can be no assurance however that the beliefs expressed herein will be consistent with future market conditions and investor behaviors.
The S&P 500 Index is a group of widely held stocks which is commonly regarded to be representative of the large capitalization stock universe. The indexes mentioned are unmanaged statistical composites of stock market or bond market performance. Investing in an index is not possible. Unmanaged index returns do not reflect any fees, expenses or sales charges.
Please consider the investment objectives, risks, charges and expenses of the fund carefully before investing. The prospectus and the summary prospectus contain this and other information about the Fund. To obtain a prospectus or a summary prospectus, contact your financial professional or download and/or request one on the resources section or call Touchstone at 800-638-8194. Please read the prospectus and/or summary prospectus carefully before investing.
Touchstone Funds are distributed by Touchstone Securities, Inc.*
*A registered broker-dealer and member FINRA/SIPC.
Not FDIC Insured | No Bank Guarantee | May Lose Value