Summary
It is difficult to discuss emerging markets (EM) as if they are some homogeneous entity. There are many moving parts; some moving up and others down. Our analysis has found that, over the last 12 years, significant downward pressure on the more commodity exposed portions of the MSCI Emerging Markets Index (MSCI EM Index), has masked growth in other portions. Change will always be a constant for EM, but we believe that the magnitude of downward pressure is likely to slow over the next decade. This in turn should allow the overall Index to outperform. It doesn’t hurt that the Index has a much lower valuation and higher dividend yield than the S&P 500®.
Higher GDP Growth and Growing Population Didn’t Seem to Matter
How many times have you heard someone justify owning EM due to younger demographics, middle class growth and expected faster GDP growth potential? We’ve said it ourselves. Relative performance for the MSCI EM Index peaked versus that of the S&P 500® in 2010 and has significantly underperformed since. Yet looking at GDP growth from 2010 on, EM countries dramatically outperformed Developed Markets (DM) countries. And this GDP growth has led to significant growth in the middle class and consumer spending. Theoretically, analysts expect this more rapid economic growth to translate to higher earnings growth for the MSCI EM Index as well as outperformance of the EM stocks.
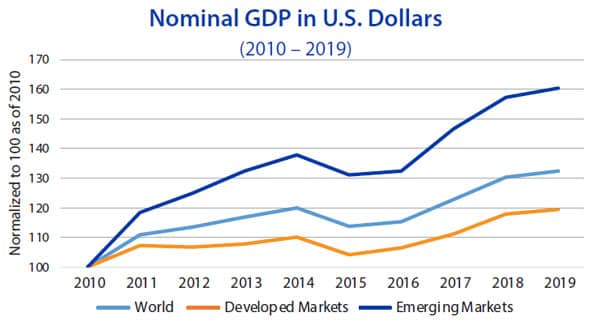
Source: The World Bank
Look Ma, No Earnings Growth
A chart of earnings and price performance appears to suggest that demographics, economic growth and middle class growth do not influence earnings. Over this same period, S&P 500® earnings have doubled. It is no wonder the MSCI EM Index has underperformed. Our work suggests that a combination of factors related to the MSCI EM Index – both fundamental and otherwise – can explain much of this underperformance. Importantly, it seems these factors are unlikely to persist in the same fashion going forward.
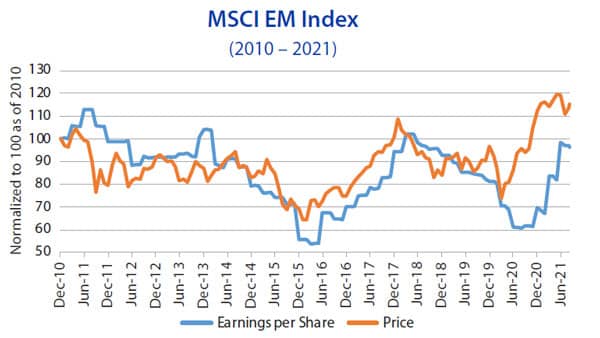 Source: Bloomberg
A Look Below the Surface
Much like an iceberg, a great deal lies beneath the surface of the MSCI EM Index. By exposing the hidden layers, we can better understand what has happened and better judge whether to invest in EM going forward. We’ve identified five such contributors that help explain the relative underperformance of the MSCI EM Index.
- Name inflation. Unlike the S&P 500®, the MSCI International Indexes can experience significant changes simply in the number of stocks they include. This can be due to changes in countries that move in and out of the Index, corporate actions such as M&A, and shifts in market cap and liquidity as well. Historically, the MSCI EM Index has included between 600-900 stocks and annual turnover, especially during market downturns, can be significant. For comparison, the S&P 500® Index is fixed at 500 names and annual turnover typically has been in the low single digits. Since 2010, the number of names in the MSCI EM Index has nearly doubled and now stands at just over 1,500. The majority of this increase was due to the inclusion of China A shares, which occurred in two tranches in 2018 and 2019. While the MSCI EM Index divisor adjusts for the additions, they still change the complexion of the Index and can impact future performance and earnings. Notably, since the addition of the China A shares, the MSCI China Index has underperformed the MSCI EM Index and produced less earnings growth.
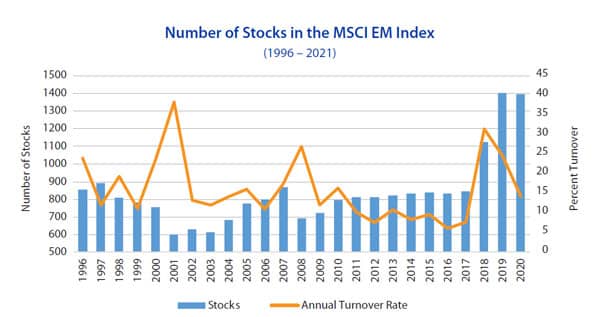
Source: Bloomberg, MSCI
- Share issuance. Based on Bloomberg data analysis, shares outstanding for the MSCI EM Index have increased by approximately 5% since 2010, or 0.5% annualized. Comparatively, the S&P 500® has seen shares decrease by approximately 2% annualized over the same period due to buybacks. We believe share issuance for MSCI EM is more a feature than a bug. Versus a DM large capitalization index like the S&P 500®, the MSCI EM Index has more exposure to earlier stage growth companies that need to access the capital markets in order to fund future growth. This has been the case for the MSCI EM Index since its inception and we believe is likely to remain so in the future.
There is a positive side to this. EM companies also appear to offer greater reinvestment opportunities than those of Developed Markets. According to a McKinsey study1, it was found that DM companies on average return close to 80% of earnings to their investors (through dividends and share buybacks) versus less than 30% for EM companies. That means that DM companies reinvested only about 20% of earnings back into their business, versus 70% for EM companies. Typically a low reinvestment rate is a sign of maturity and signals that a company lacks business investment opportunities that can deliver returns higher than its current operations. Growing companies, however, often reinvest a greater portion of earnings back into their business.
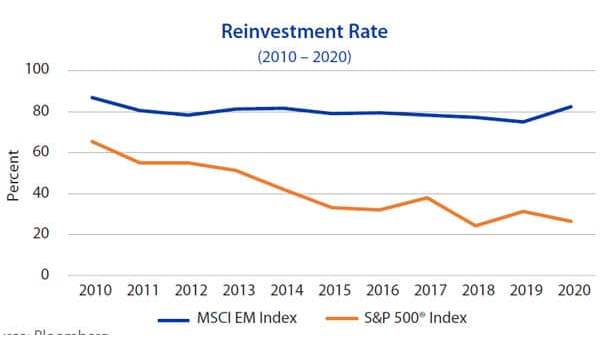
Source: Bloomberg
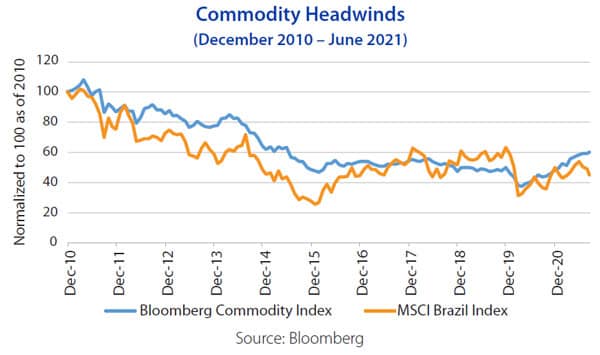
- Change in geographic mix. According to Alpine Research, commodity producing countries weight in the MSCI EM Index has dropped from 60% to 25% over the last 20 years. Much of that decline occurred over the last 10 years as China slowed its rate of growth of infrastructure spending, thereby halting a major commodity price boom. Such a dramatic change in exposure can lead to internal disruption within the Index. For instance, at the end of 2010 Brazil was the second largest weight in the MSCI EM Index, with a number of Brazilian energy and metal stocks occupying the top spots. On a price basis the MSCI Brazil Index declined by more than 50% since then. When one of the largest weights in an index surrenders more than half its value, the rest of the holdings in the index have to do that much more work just to get the overall index back to even.
 It is worth mentioning positives to the current mix. Countries with current surpluses have increased substantially, representing over 73% of the MSCI EM Index at the end of 2020 (using CEIC data). China, Taiwan, South Korea and Russia all run account surpluses and have little in the way of foreign currency debt. As such, EM through the lens of a market-cap-based index is less tied to U.S. monetary policy and U.S. currency moves than in the past.
- Index compositional changes. The geographical mix changes have spilled over to sector and industry exposure. While the price of the MSCI EM Index is near where it was at the end of 2020, there has been dramatic movement within its sectors. At the end of 2010 the Energy and Materials sectors represented almost 30% of the MSCI EM Index. Oil and commodity prices fell into a secular decline thereafter. Earnings of commodity producers typically have been highly sensitive to the price of the commodity thus creating a significant earnings headwind for the overall MSCI EM Index to overcome. While all indexes have seen compositional changes over time, they have not seen changes to this degree.
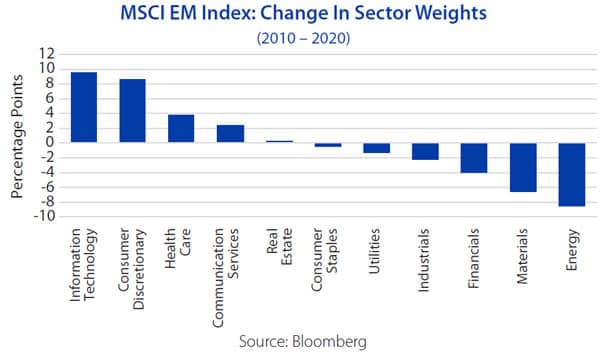 These compositional changes occurred within countries as well. The sector weighting changes for the MSCI China Index have been more dramatic than for the broad MSCI EM Index. And much like the MSCI EM Index, those sectors and industries which declined, masked the rise of other sectors and industries within the MSCI China Index. Since the end of 2010, the weight of the Consumer Discretionary sector that includes stocks such as Alibaba, JD.com, and Meituan increased by 27 percentage points while the Energy sector fell by 17 percentage points. The S&P 500® offered no comparison to such massive changes, even over longer periods of time. This is not to suggest that one shouldn’t expect compositional changes to the MSCI EM Index, rather that a similar magnitude of such changes appears unlikely.
- Valuation. One other factor that held back relative performance had nothing to do with the MSCI EM Index and that was Price/Earnings (P/E) multiple expansion. The P/E multiple on the S&P 500® increased by 7.7 multiple points (from 13.7x to 21.4x forward 4Q earnings estimates) since 2010 while the forward P/E multiple for the MSCI EM Index remained unchanged at 12.9x. The P/E multiple expansion alone since 2010 added 4.5 percentage points to the annualized return for the S&P 500® through September 2021.
 One could justify higher valuation for the S&P 500® based on lower interest rates and a shift in composition toward the Growth style. But by the same logic, valuation for the MSCI EM Index should be higher for the same reasons. EM interest rates have come down and the compositional change for MSCI EM Index toward the Growth style has been even more dramatic than for the S&P 500®. Yet the MSCI EM Index multiple has not expanded. Given the changes in the composition of the MSCI EM Index towards higher growth sectors, we think it should have a higher P/E multiple.
Reasons to Keep EM on Your Radar
MSCI’s decision to integrate China A shares into the MSCI EM Index did have a negative near-term impact in terms of composition and performance. However, we don’t foresee further A share integration given how much MSCI has done already, and because the deteriorating U.S./China relationship may influence MSCI’s decision-making (MSCI is an American company). EM share issuance is likely to continue to be an earnings headwind, as it is a natural by-product of investing in companies in developing countries. While geographic and compositional changes are to be expected, we doubt they will match the magnitude seen over the last 12 years, nor pose the same headwinds. Earnings for commodity producers are highly correlated with commodity prices, which have been in a secular bear market since 2010. China has been at the center of much of this as it shifted from spending on infrastructure and manufacturing towards a consumption-based economy. We believe this shift will continue, though the pace has slowed and markets have adjusted to a lower rate of infrastructure spending. Lastly the forward P/E gap between the S&P 500® and the MSCI EM Index is the widest in history. As such, we do not see that as a headwind going forward, and believe it could turn into a tailwind.
We do think that the economic growth potential for EM continues to be much better than for DM, in part because of demographics and middle class growth. We also believe that this economic growth (along with better relative valuations) will help EM outperform DM. That said, we believe that, much the same as for the last 10 years, the true opportunities lie inside of the MSCI EM Index.
Opportunity Calling …
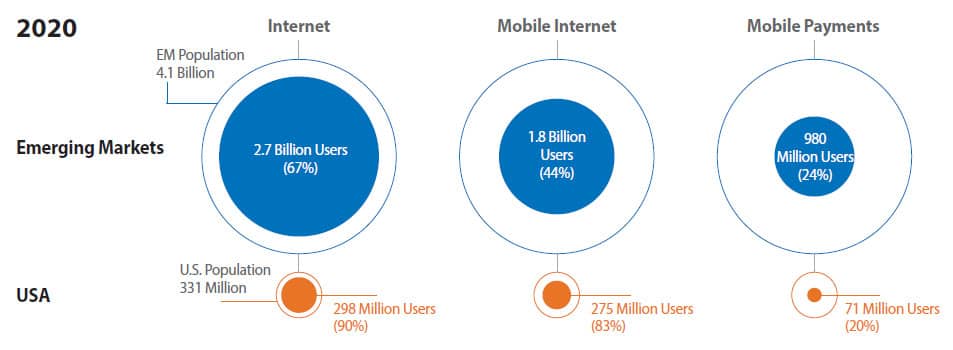
As an example, seemingly one of the biggest growth opportunities for EM relates to the smartphone. It is not the smartphone itself, but all the applications and industries that are proliferating from it. Just think about when the automobile flourished and all the industries it created that didn’t exist prior – from highways to gas stations, fast food chains, housing (suburbs), billboards, motels and many more businesses not directly associated with making cars. The smartphone is having a similar impact and it remains an underpenetrated market in EM. The accompanying chart creates perspective on not just the penetration, but also the sheer size of the EM. Another factor when considering this chart is that a user is not an owner. It is not unusual for a whole family in an EM to share one smartphone, but each family member will still be counted as a separate user. As such, these rates likely overstate the true level of market penetration.
 Sources: World Bank, DataReportal, VentureBeat, Juniper Research, SPMP Research, Pew Research
Glossary of Investment Terms and Index Definitions
This commentary is for informational purposes only and should not be used or construed as an offer to sell, a solicitation of an offer to buy, or a recommendation to buy, sell or hold any security. There is no guarantee that the information is complete or timely. Past performance is no guarantee of future results. Investing in an index is not possible. Investing involves risk, including the possible loss of principal and fluctuation of value. Please visit touchstoneinvestments.com for performance information current to the most recent month-end.
Please consider the investment objectives, risks, charges and expenses of the fund carefully before investing. The prospectus and the summary prospectus contain this and other information about the Fund. To obtain a prospectus or a summary prospectus, contact your financial professional or download and/or request one on the resources section or call Touchstone at 800-638-8194. Please read the prospectus and/or summary prospectus carefully before investing.
Touchstone Funds are distributed by Touchstone Securities, Inc.*
*A registered broker-dealer and member FINRA/SIPC.
Not FDIC Insured | No Bank Guarantee | May Lose Value