Equity Return Potential
Conclusion: The top heavy S&P 500® continues to skew the interpretation of returns with the top 10 highest weighted stocks rising 52% to-date through August. Meanwhile the equal weighted S&P 500® Index is up just 6%. Earnings estimates have begun to rise, reflecting better-than-expected economic conditions. Yet, economic growth is expected to decelerate in 2024, which is in contrast with consensus analyst estimates for EPS growth of 11%.
Market Cycles
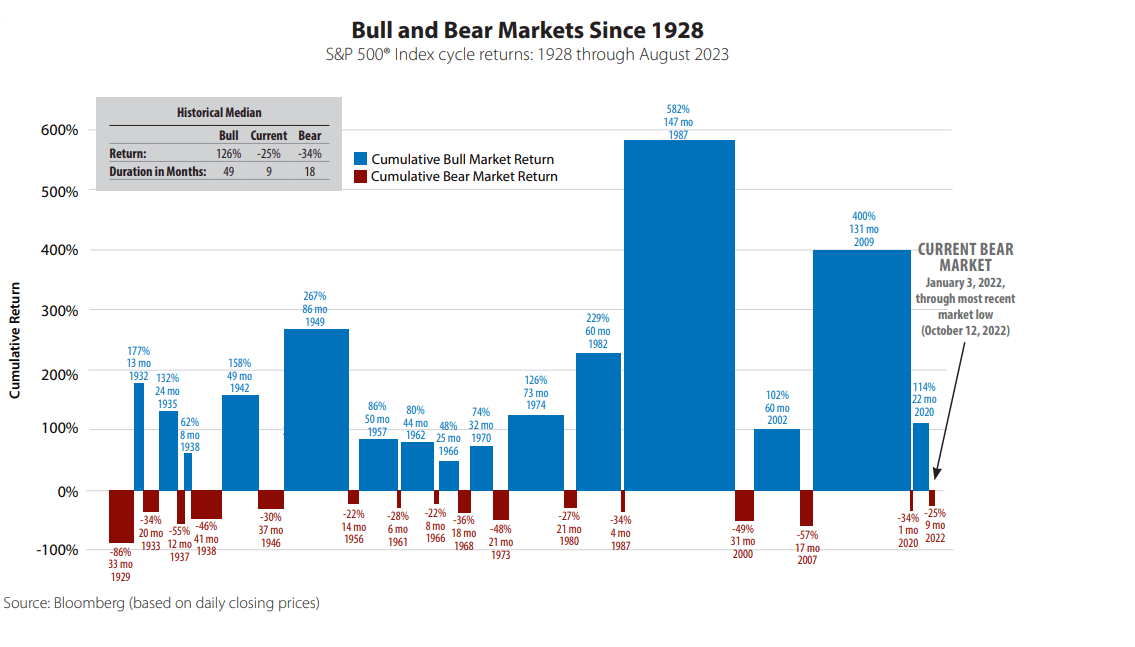
The S&P 500® officially entered a bear market in January 2022. Many believe that a new bull market started in October 2022, though the nature of the rally is uncharacteristic of an early cycle. We are waiting for more data before determining whether a new cycle has begun.
Economic Cycle
The speed of this cycle speaks to the truly unique circumstances surrounding it. Customarily, the economy takes the elevator down and the stairs back up. High levels of cash savings and pent up demand have allowed for a rapid economic recovery. We continue to believe there is a high risk of recession in the next 12 months, which would be consistent with our model indicating late cycle conditions. No recession would indicate limited economic sensitivity to higher interest rates. We believe there are factors that have insulated the economy from higher interest rates, though many of these are related to fiscal policies that are depleting (e.g., savings) or expiring (e.g., student loan forgiveness).

*Model based on Capacity Utilization,
Unemployment Rate, Treasury yield spreads, Consumer Confidence Indexes, and
Conference Board business cycle indicators
Source: Bloomberg
Fundamentals
We see earnings growth as the key to the market cycle, with profit margin expansion and contraction being the key source of earnings cyclicality. The previous short bull market saw strong earnings growth with profit margin expansion being the dominant driver. Profit margins rose 300 basis points during that short cycle. The limited ability to expand margins from here is likely to lower longer term EPS growth potential. Our proprietary EPS model suggests that S&P 500® EPS will decline over the next 8 months, though it is showing signs of bottoming.
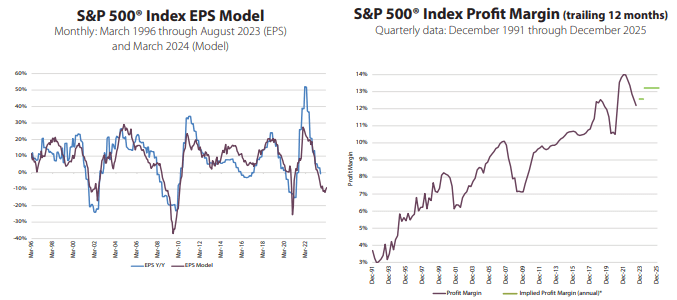
The EPS Model is based on the 10 year Treasury yield, Leading Economic Index, and PMI New Orders. *Based on analysts’ annual estimates for revenue and EPS.
Source: Bloomberg, S&P Dow Jones Indexes
Valuation
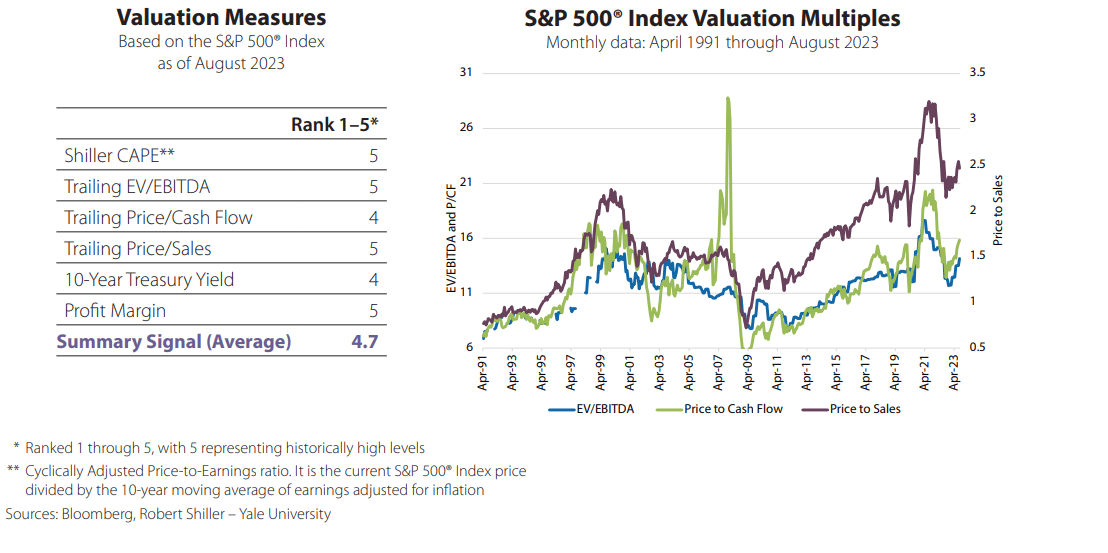
All valuation measures have their flaws, this is why we use numerous and different measures. Most valuation measures have been rising as the market rally has been unsupported by improving fundamentals.
Touchstone Equity Risk Model
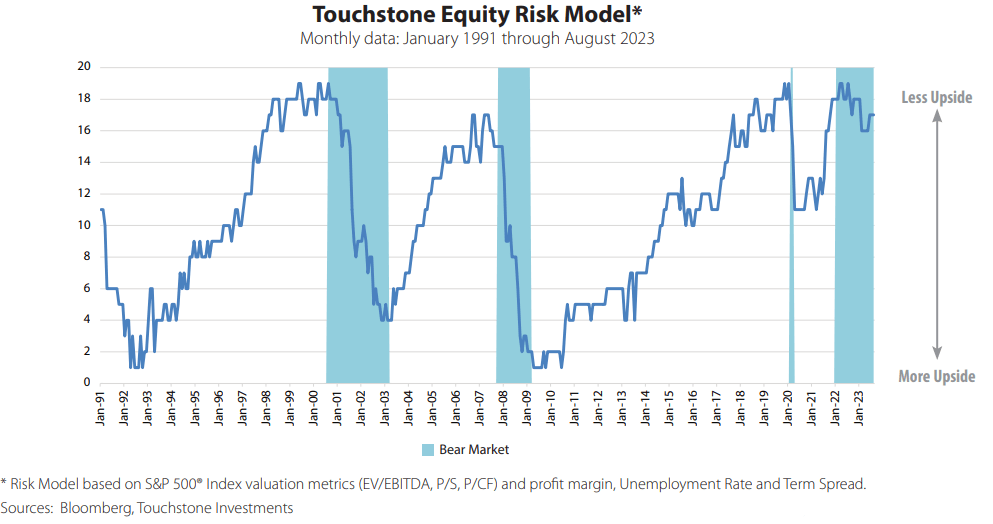
The Touchstone Equity Risk Model brings together the economic cycle, market fundamentals, and valuation considerations (depicted in previous sections). It is a way to measure potential upside based on fundamentals, though we recognize that sentiment can carry the market beyond what the fundamentals suggest. While the model has improved modestly, it continues to suggest caution.
Glossary of Investment Terms and Index Definitions
This commentary is for informational purposes only and should not be used or construed as an offer to sell, a solicitation of an offer to buy, or a recommendation to buy, sell or hold any security. There is no guarantee that the information is complete or timely. Past performance is no guarantee of future results. Investing in an index is not possible. Investing involves risk, including the possible loss of principal and fluctuation of value. Please visit touchstoneinvestments.com for performance information current to the most recent month-end.
Please consider the investment objectives, risks, charges and expenses of the fund carefully before investing. The prospectus and the summary prospectus contain this and other information about the Fund. To obtain a prospectus or a summary prospectus, contact your financial professional or download and/or request one on the resources section or call Touchstone at 800-638-8194. Please read the prospectus and/or summary prospectus carefully before investing.
Touchstone Funds are distributed by Touchstone Securities, Inc.*
*A registered broker-dealer and member FINRA/SIPC.
Not FDIC Insured | No Bank Guarantee | May Lose Value