Style Drivers
Conclusion: Both Value and Growth stocks declined in 2022, though Growth stocks fell much further than Value stocks. Growth stocks have recaptured some of those relative losses year-to-date. But just like the broad market, the performance within the Growth index has been very narrow with the 10 largest stocks accounting for nearly all of the gains. The vast majority of these gains have come from P/E multiple expansion as opposed to rising earnings estimates. Admittedly, capturing the swings between Growth and Value has been a struggle; we remain comfortable maintaining equal exposure to both styles until we get better visibility on the fundamental drivers.
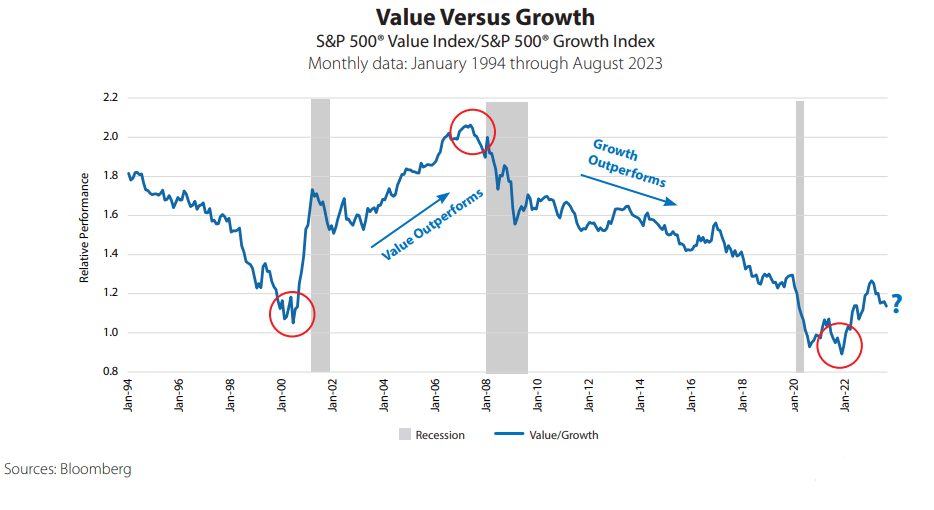
Style Cycle Duration & Return
Historically, style leadership changes have typically occurred near the end of an economic cycle. This did not occur in the COVID-19-driven downturn. We believe this is due in part to the nature of the environment that materially benefited many Growth companies and had the opposite effect on many Value companies. The pandemic may have delayed the transition.
Recently, the relative performance of the Value Index moved up through a long-term downward trendline, which could indicate the beginning of a more sustainable period of outperformance, though we would want to see some relative earnings strength for confirmation.
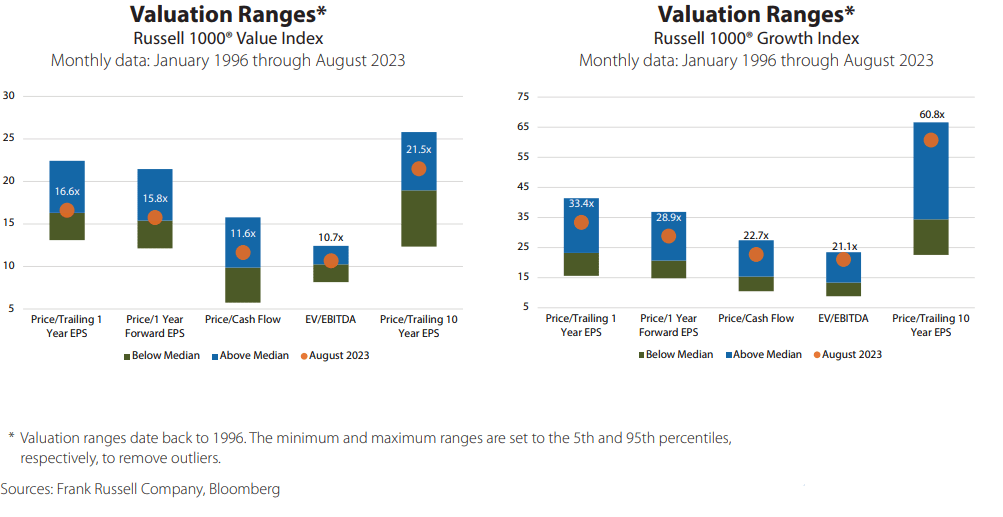
Relative Valuation
Comparative valuation is difficult, as Value sectors and stocks tend toward valuation measures that differ from Growth sectors and stocks. In recognition of this, we have incorporated a number of different valuation measures. While relative valuation certainly leans Value, on an absolute basis the Value index is not cheap relative to its own history.
Relative Fundamentals
- Generally, relative price performance follows relative earnings. It is difficult to compare earnings between the Growth and Value indexes as the Value index has both cyclical (e.g., Financials) and defensive (e.g., Utilities) stock exposure while the Growth index is composed of mostly less cyclical companies.
- It is interesting to note that Value’s outperformance in 2022 was not accompanied by relative earnings strength. This is consistent with the notion that Growth stocks underperformed as they repriced lower due to higher interest rates and not a change in relative fundamentals. This year, through August, the relative earnings trend has slightly favored the Growth index, though it doesn’t explain the magnitude of Growth’s outperformance.

*Normalization adjusts or rescales the values of different time series to a notionally common scale to allow for comparability.
**The spread is the difference in the normalized units in the chart above. Sources: Frank Russell Company, Bloomberg
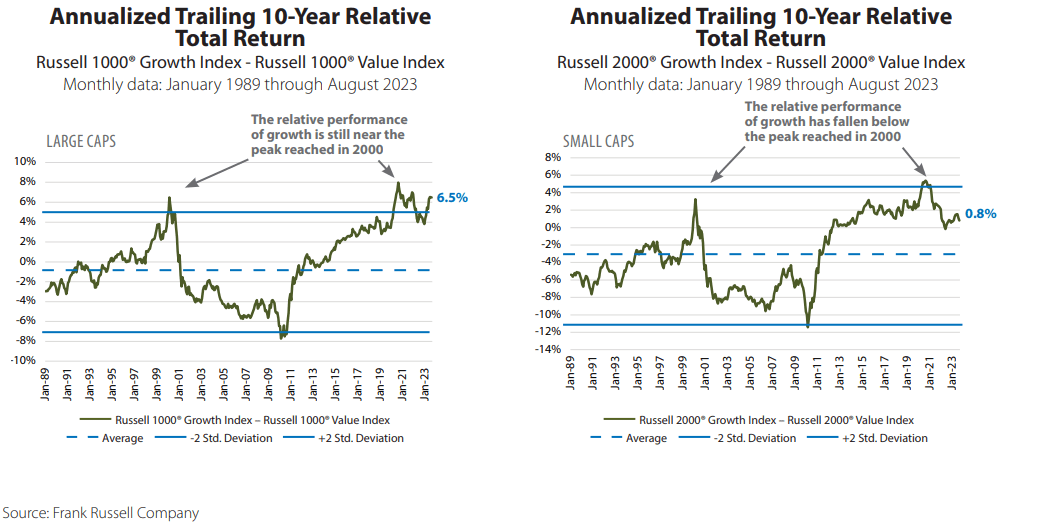
Value Poised to Do Better?
On a rolling 10 year basis, the Growth indexes continue to dominate. Historically, Value has outperformed, as the average for both charts is below zero. Will there be a reversion to the mean? Small caps have been demonstrating a greater predilection toward mean reversion versus large caps.
Glossary of Investment Terms and Index Definitions
Eugene Fama & Kenneth French, The Cross Section of Expected Stock Returns, Journal of Finance, June 1992.
This commentary is for informational purposes only and should not be used or construed as an offer to sell, a solicitation of an offer to buy, or a recommendation to buy, sell or hold any security. There is no guarantee that the information is complete or timely. Past performance is no guarantee of future results. Investing in an index is not possible. Investing involves risk, including the possible loss of principal and fluctuation of value. Please visit touchstoneinvestments.com for performance information current to the most recent month-end.
Please consider the investment objectives, risks, charges and expenses of the fund carefully before investing. The prospectus and the summary prospectus contain this and other information about the Fund. To obtain a prospectus or a summary prospectus, contact your financial professional or download and/or request one on the resources section or call Touchstone at 800-638-8194. Please read the prospectus and/or summary prospectus carefully before investing.
Touchstone Funds are distributed by Touchstone Securities, Inc.*
*A registered broker-dealer and member FINRA/SIPC.
Not FDIC Insured | No Bank Guarantee | May Lose Value