Interest Rate Risk
Conclusion: With the U.S. Federal Reserve Board (Fed) nearing the end of its rate raising cycle and economic growth slowing, we have grown concerned about reinvestment risk at the short end of the curve. Historically inverted yield curves un-invert at a fairly rapid pace. We acknowledge that history may not repeat in this cycle. The trend in inflation and the economy will play an important role in how quickly or slowly the Fed lowers interest rates.
Monetary Policy
-
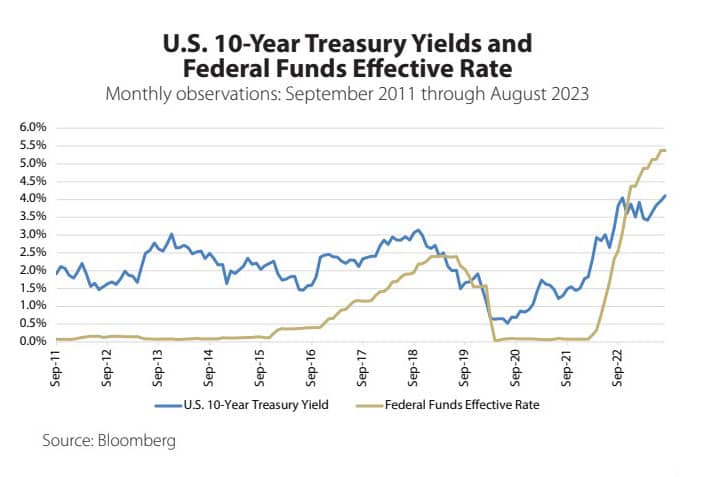
In its effort to accomplish its dual goals of maximum employment and stable inflation, the Fed tends to adjust its policy in a counter cyclical fashion. Efforts to stimulate (restrict) the economy through monetary policy generally led to higher (lower) long-term interest rates and vice versa over time.
- The Federal Funds rate has significantly moved above the yield on the 10-year Treasury bond and the Fed still may do more.
- 10-year yields may have broken out of a four-decade pattern of making lower lows in each cycle. We believe it is possible that rates settle at a higher level than seen in the last two cycles, though we do not anticipate moving into a secular period of rising rates.
Supply
Supply refers to lending and is represented by savings and investments. Excess supply puts downward pressure on interest rates.
- The vast majority of U.S. savings are held by consumers, including contributions to pension plans.
- Retirement savings have swelled as the Baby Boom generation nears retirement age. Typically, there has been a tendency to accelerate the pace of savings and begin to make asset allocation changes toward less risky, more income-generative assets (e.g., bonds), as one gets closer to retiring and into retirement.
- The supply/demand approach to interest rates can also be thought of as savings versus investment. Savings represents money looking to lend, while investment represents money looking to borrow, and rates adjust to accommodate changes in these two factors. The right chart below broadly depicts this relationship. Fiscal stimulus measures to offset the pandemic significantly added to savings. Consumers, though, had been spending down their savings. As a partial offset, higher interest rates are likely to attract more supply and discourage investment.

Demand
- Demand refers to borrowing (or investment). Excess demand puts upward pressure on interest rates, while insufficient demand puts downward pressure on interest rates. In the past, we have used measures of the change in debt outstanding to indicate whether demand is abundant or scarce. There had been a dramatic increase in borrowing by the government and business sector, but we believe showing these figures would be distortionary. The vast majority of debt issuance has gone not toward investment, but toward replacing lost income and the building up of cash.
- One of the main channels of monetary policy is to encourage or discourage investment. Certainly higher mortgage rates are having an impact. Business investment had begun to roll over, though spending intentions increased significantly since April, possibly related to the CHIPS and IRA spending acts.

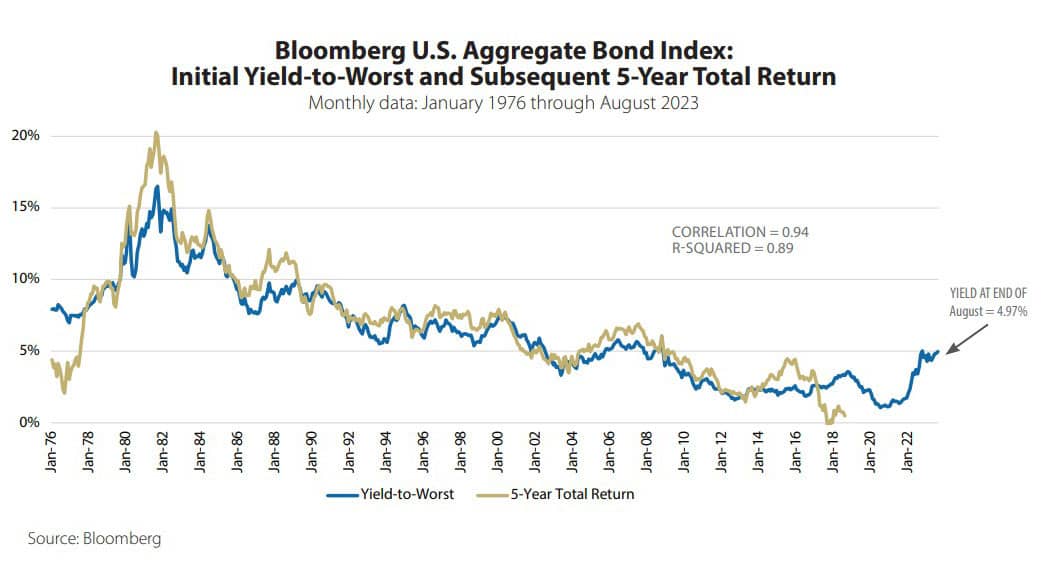
Simple Bloomberg U.S. Aggregate Bond Index Model Suggests Low Returns
Given that the Bloomberg U.S. Aggregate Bond Index typically had a duration of around five years, its current yield has historically tended to be a reasonable estimate for the total return of the index over the next five years. More recently, a higher level of duration has increased the volatility of returns. The yield on the Bloomberg U.S. Aggregate Bond Index has risen to a level that is more attractive.
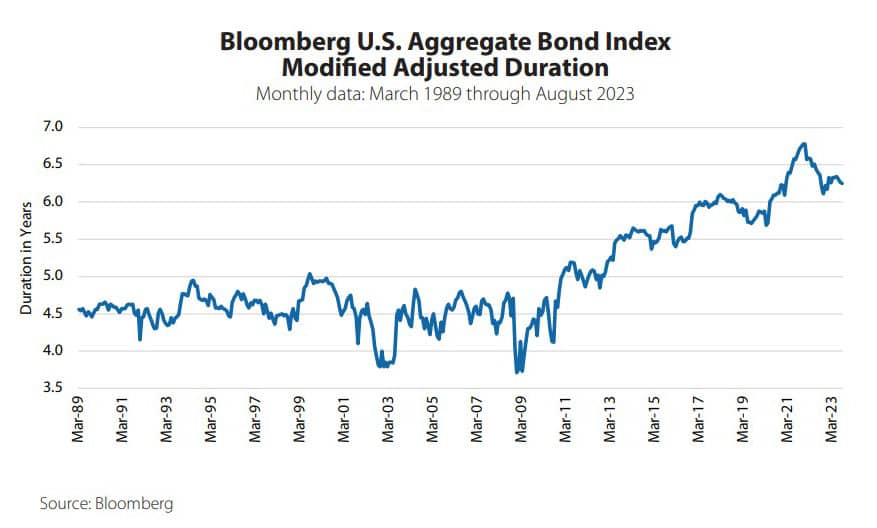
Bloomberg U.S. Aggregate Bond Index Duration Extended
Duration is a measure of a bond’s price sensitivity to changes in interest rates. As duration rises, bonds become more sensitive to changes in interest rates. Lower interest rates and longer maturity Treasury and corporate bond issuance extended the duration over the course of the last decade. This higher level of duration has increased the price volatility of the Index.
Glossary of Investment Terms and Index Definitions
This commentary is for informational purposes only and should not be used or construed as an offer to sell, a solicitation of an offer to buy, or a recommendation to buy, sell or hold any security. There is no guarantee that the information is complete or timely. Past performance is no guarantee of future results. Investing in an index is not possible. Investing involves risk, including the possible loss of principal and fluctuation of value. Please visit touchstoneinvestments.com for performance information current to the most recent month-end.
Please consider the investment objectives, risks, charges and expenses of the fund carefully before investing. The prospectus and the summary prospectus contain this and other information about the Fund. To obtain a prospectus or a summary prospectus, contact your financial professional or download and/or request one on the resources section or call Touchstone at 800-638-8194. Please read the prospectus and/or summary prospectus carefully before investing.
Touchstone Funds are distributed by Touchstone Securities, Inc.*
*A registered broker-dealer and member FINRA/SIPC.
Not FDIC Insured | No Bank Guarantee | May Lose Value