Emerging Markets vs. U.S.
We believe equity investors should consider emerging market stock exposure due to the following more secular qualities:
- Diversification: portfolios that included emerging market stocks have historically produced higher risk-adjusted returns (Bouslama and Ouda).
- Relative Economic Growth: Emerging markets are expected to account for 70% of global economic growth through 2025 with middle class spending growth being the main driver (McKinsey & Co).
- Growing Middle Class: by 2025 emerging market consumption will represent approximately half of global consumption (McKinsey & Co).
- Equity Market Expansion: Emerging market equities represent only 11% of global equity market capitalization (Source: MSCI), yet their economies represent approximately 45% of global GDP (Source: International Monetary Fund). .
But why now…?
Conclusion: We removed our overweight after seeing signs that China’s rebound was losing steam. China’s growth prospects have stalled with a property sector slowdown, weak exports, and consumers choosing savings over spending. But the government has the capacity to add stimulus, valuations are low, and sentiment is very negative. Outside of China, the picture is brighter as inflation recedes and pressure from the Fed is likely done.
Valuation
- Emerging markets have historically experienced significant price swings, creating large valuation peaks and valleys. Currently, the MSCI Emerging Markets Index looks attractive relative to the S&P 500® Index. On a price-to-trailing-10-year-earnings basis, which smooths earnings cycles, the MSCI Emerging Markets Index traded at 13.5x versus 33.5x for the S&P 500® Index (as of August 31, 2023).
- Relative to its own history, the MSCI Emerging Markets Index is generally trading below its historical medians. It should be noted that the composition of the Index has changed fairly dramatically over the last 10 years, making historical comparisons more difficult. The absolute levels of the various valuation measures are well below those of developed market indexes.
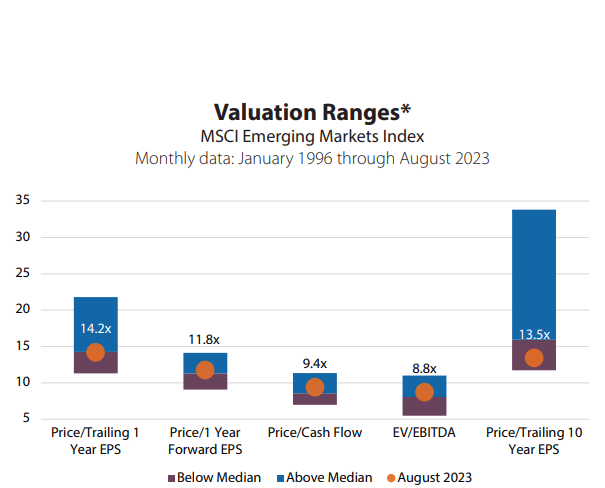
*Based on monthly data starting in 1996. The minimum and maximum ranges are set to the 5th and 95th percentiles, respectively, to remove outliers.
Sources: Bloomberg, MSCI
Relative Earnings Prospects
- Relative price performance and relative earnings growth have historically followed similar paths. S&P 500® Index earnings have been outpacing MSCI Emerging Markets Index earnings since 2008, helping explain S&P 500® Index outperformance. Compositional changes to the EM Index (not fundamentals) explain much of this underperformance, and they are unlikely to be repeated.
- MISCI EM earnings are down 20% from their 2022 peak and are below where they were in 2019. While disappointing, we believe that when the global economy begins to turn up, EM is likely to lead the way with strong earnings growth.
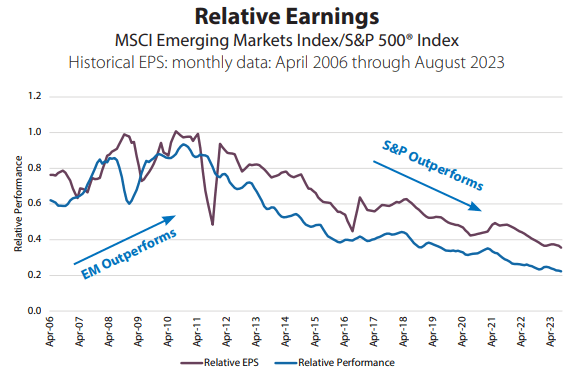
Sources: Bloomberg, Bloomberg Consensus Estimates, MSCI
Trend in Emerging Markets Currency
- The MSCI Emerging Markets Index is quoted in U.S. dollars (USD). As such, currency shifts between the USD and emerging markets currencies will impact returns directly, though it is interesting to note that over the last 10 years, the dollar has been much less volatile versus emerging markets than versus developed markets.
- While the USD has moved higher relative to developed country currencies, the move has been much more modest versus emerging markets. This is despite more hawkish signals from the Fed and the war in Ukraine. In the past, this type of stress would be more apparent in the emerging markets. Emerging markets have held up through the pandemic and now slowing monetary tightening and inflation is suggestive of a generally more stable emerging markets landscape.
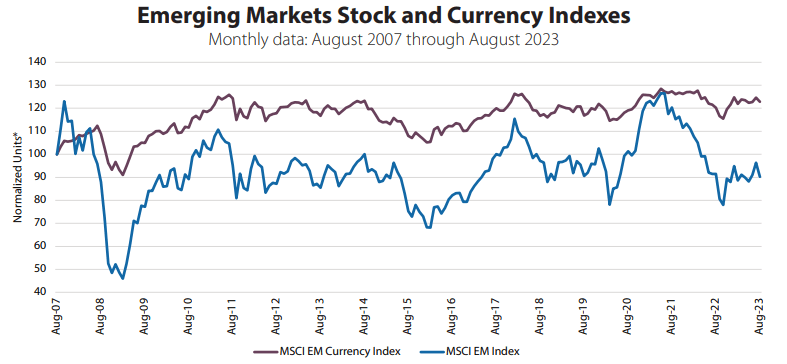
*Normalization adjusts or rescales the values of different time series to a notionally common scale to allow for comparability. Source: MSCI
The emerging market equity index weight is under-represented in a global context given their relative size by other measures.
In March, MSCI removed Russia from the Emerging Markets Index. This led to a significant drop in the number of companies in the Index and a more modest decline in the index weight. We also adjusted the gross domestic product (GDP) and population estimates, using 2021 estimates from the International Monetary Fund (IMF).
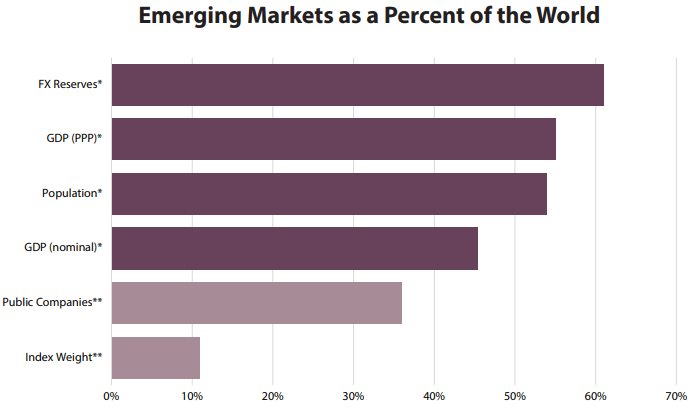
Sources: *International Monetary Fund (IMF) (2017, 2021), **MSCI (August 2023)
Emerging Markets Perspective
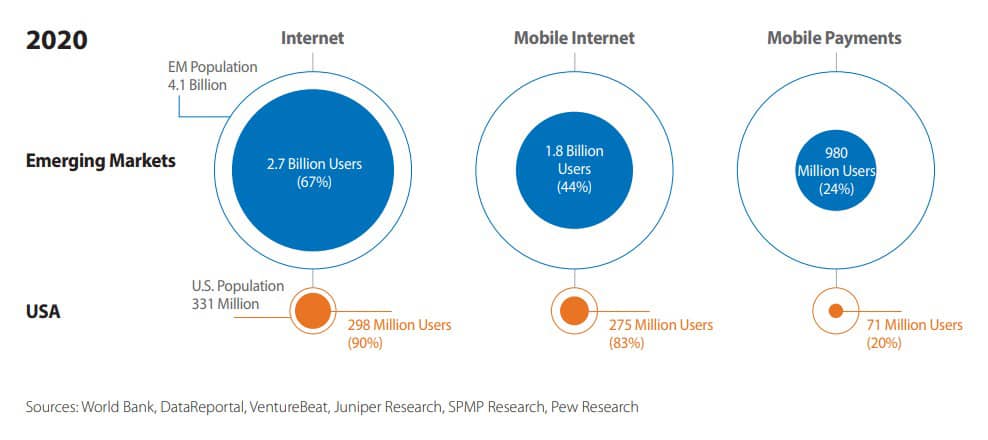
One of the biggest growth opportunities for emerging markets relates to the smartphone. It is not the smartphone itself, but all the applications and industries that come along with it. Just think about when the automobile became ubiquitous and all the industries it created that didn’t exist prior—from highways to gas stations, fast food chains, housing (suburbs), billboards, motels, and many other businesses not directly associated with making cars. The smartphone is having a similar impact and it remains an underpenetrated market in emerging markets. The following chart creates perspective on not just the penetration, but also the sheer size of the emerging markets. Another factor to consider when looking at this chart is that a user is not an owner. It is not unusual for a whole family in an emerging market to share one smartphone, but each family member will still be counted as a separate user. As such, these rates likely overstate the true level of market penetration.
Glossary of Investment Terms and Index Definitions
Ons Bouslama, Olfa Ben Ouda, International Portfolio Diversification Benefits: The Relevance of Emerging Markets, International Journal of Economics and Finance, 2014. McKinsey & Company, Winning the $30 trillion Decathlon – Going for gold in emerging markets, 2012.
This commentary is for informational purposes only and should not be used or construed as an offer to sell, a solicitation of an offer to buy, or a recommendation to buy, sell or hold any security. There is no guarantee that the information is complete or timely. Past performance is no guarantee of future results. Investing in an index is not possible. Investing involves risk, including the possible loss of principal and fluctuation of value. Please visit touchstoneinvestments.com for performance information current to the most recent month-end.
Please consider the investment objectives, risks, charges and expenses of the fund carefully before investing. The prospectus and the summary prospectus contain this and other information about the Fund. To obtain a prospectus or a summary prospectus, contact your financial professional or download and/or request one on the resources section or call Touchstone at 800-638-8194. Please read the prospectus and/or summary prospectus carefully before investing.
Touchstone Funds are distributed by Touchstone Securities, Inc.*
*A registered broker-dealer and member FINRA/SIPC.
Not FDIC Insured | No Bank Guarantee | May Lose Value