Mid caps are often overlooked in many investors’ portfolios. Mid-cap stocks represent approximately 24% of the market capitalization of the U.S. equity market.1 However, investors are significantly underweight the group with only 11% exposure.2
By not participating in the mid-cap arena, investors are potentially missing out on a major portion of the market. Just as it is important to diversify portfolios across various sectors of the market, it is also important to diversify across market capitalizations.
Mid-cap stocks tend to be under-researched by Wall Street analysts, which may lead to opportunities. The prices of stocks with less analyst coverage may not fully reflect all relevant company data and, therefore, may be mispriced. These gaps in sell-side research coverage create opportunities for portfolio managers and analysts to identify and exploit the information inefficiencies of promising companies that are experiencing significant growth.
1 Source: The Frank Russell Company as of 12/31/2021
2 Source: Morningstar Direct as of 12/31/2021
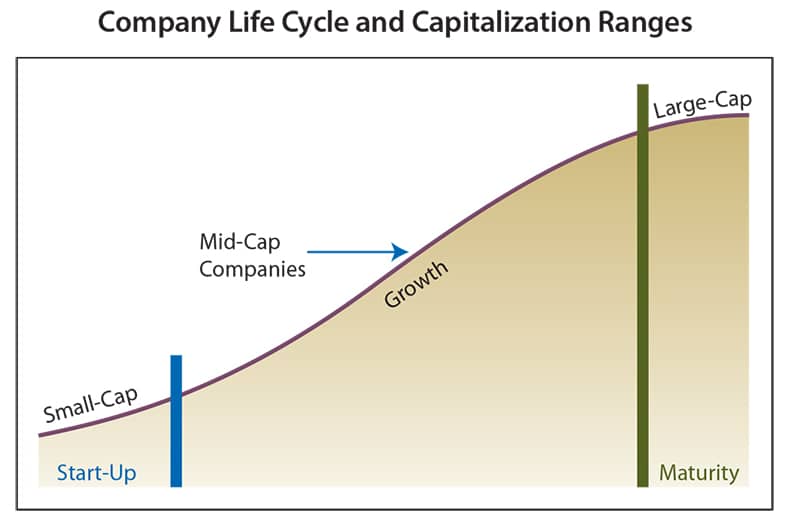
Company Life Cycle
A great number of companies experience several stages throughout their "life cycle." The first stage begins when a new company is launched. "Start-Up" companies have the lowest market capitalizations as they have yet to generate significant earnings or expectations. Companies that survive the "Start-Up" phase evidence a compelling product or service and/or a level of earnings that justify a higher valuation and additional capital investment. At this point, companies are moving into the "Growth" phase of the life cycle. Companies in this stage tend to be less volatile than small caps, can more easily adapt to change and have higher return potential than large-cap companies. The large-cap stage signifies the "Maturity" stage of a company when growth rates and expectations of future growth slow.
Advantages of Mid Caps
Mid-cap stocks may be under-allocated in many portfolios, but the case for mid-cap investing is compelling. Mid-cap stocks are uniquely positioned between small, developing companies and large, mature companies. Mid-cap companies are typically small-cap companies that have succeeded. Because they have survived the small-cap phase, mid caps are in a position to benefit from enhanced access to the capital markets, potentially giving them a financial advantage over small caps. Compared to large-cap companies, mid caps are often in the growth phase of the business life cycle where they may be experiencing higher cash flows and earnings growth rates.
Long Record of Outperformance
Mid-cap stocks, as measured by the Russell Midcap® Index, have outperformed both large-and small-caps over the past 44 years. Mid caps generally have outperformed because they have seen both cash flow and earnings per share accelerate, especially compared to large caps. Investing in stocks of mid-cap companies may be subject to more erratic market movements than stocks of larger, more established companies.
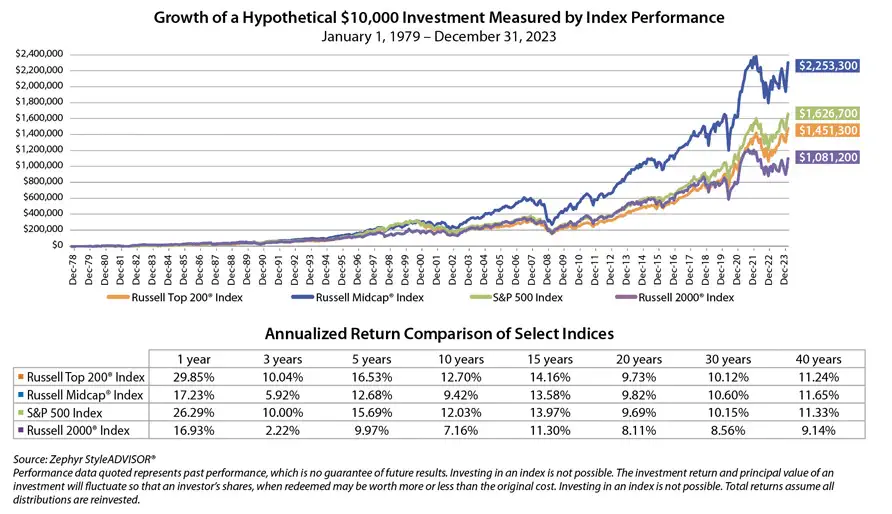
As of December 31, 2023, the annualized returns of the Russell Midcap® Index have experienced typically higher absolute returns during the last 44 years when looking at 20-Year Rolling Returns than the Russell Top 200® Index (large caps), the Russell 2000® Index (small caps), and the S&P 500 Index (a leading indicator of the stock market).
.jpg?h=360&w=820&rev=0e75edda3bc748c5a5d196be1e554fe6&hash=F7949748C5365E822871591CA54B918B)
Risk/Reward Relationship
Relative to small-cap companies, mid-cap companies generally have less risk as their businesses are more diversified and have better access to capital. Relative to large-cap companies, mid-cap companies have the potential to generate higher earnings growth and have less complex business models. This balance has provided consistent risk-adjusted performance.

Marketing Measures
Russell 2000® Index measures the performance of the small-cap segment of the U.S. equity universe. The Russell 2000® Index is a subset of the Russell 3000® Index. It includes approximately 2,000 of the smallest securities based on a combination of their market cap and current index membership.
Russell Top 200® Index measures the performance of the largest cap segment of the U.S. equity universe. The Russell Top 200® Index is a subset of the Russell 3000® Index. It includes approximately 200 of the largest securities based on a combination of their market cap and current index membership.
Russell Midcap® Index measures the performance of the mid-cap segment of the U.S. equity universe. The Russell Midcap® Index is a subset of the Russell 1000® Index. It includes approximately 800 of the smallest securities based on a combination of their market cap and current index membership.
Standard & Poor's 500 Index consists of 500 stocks chosen for market size, liquidity and industry grouping, among other factors. The S&P 500 is designed to be a leading indicator of U.S. equities and is meant to reflect the risk/return characteristics of the large cap universe.
Russell Indexes:
The Frank Russell Company (FRC) is the source and owner of the data contained or reflected in this material and all trademarks and copyrights related thereto. The material may contain confidential information and unauthorized use, disclosure, copying, dissemination or redistribution is strictly prohibited. This is a Touchstone Investments presentation of the data, and FRC is not responsible for the formatting or configuration of this material or for any inaccuracy in the presentation thereof.
The indexes mentioned are unmanaged statistical composites of stock market or bond market performance. Investing in an index is not possible. Unmanaged index returns do not reflect any fees, expenses or sales charges.
A Word About Risk
The Funds invest in equities which are subject to market volatility and loss. The Funds invest in stocks of small- and mid-cap companies, which may be subject to more erratic market movements than stocks of larger, more established companies. The Funds may invest in growth stocks which may be more volatile than investing in other stocks and may underperform when value investing is in favor. The Funds may invest in value stocks which may not appreciate in value as anticipated or experiences a decline in value. The Funds may invest in foreign securities which carry the associated risks of economic and political instability, market liquidity, currency volatility and accounting standards that differ from those of U.S. markets and may offer less protection to investors. The Funds may experience higher portfolio turnover which may lead to
increased fund expenses, lower investment returns, and higher short-term capital gains taxable to shareholders. The Fund’s investments in other investment companies will be subject to substantially the same risks as those associated with the direct ownership of the securities comprising the portfolios of such investment companies, and the value of the Fund’s investment will fluctuate in response to the performance of such portfolios. In addition, if the Fund acquires shares of investment companies, shareholders of the Fund will bear their proportionate share of the fees and expenses of the Fund and, indirectly, the fees and expenses of the investment companies. The Fund may focus its investments in specific sectors and therefore is subject to the risk that adverse circumstances will have greater impact on the fund than on the fund that does not do so. Banks and financial services companies could suffer losses if interest rates rise or economic conditions deteriorate. Events affecting the financial markets, such as a health crisis, may at times result in unusually high market volatility, which could negatively impact Fund performance and cause it to experience illiquidity, shareholder redemptions, or other potentially adverse effects. Current and future portfolio holdings are subject to risk. The advisor engages the sub-advisor to manage the Funds’ portfolio; it may be unable to identify and retain a sub-advisor who achieves superior investment returns relative to other similar sub-advisors.
Performance data quoted represents past performance, which is no guarantee of future results. The investment return and principal value of an investment in the Fund will fluctuate so that an investor’s shares, when redeemed, may be worth more or less than their original cost. Current performance may be higher or lower than performance data given. For performance information current to the most recent month-end, visit TouchstoneInvestments.com/mutual-funds.
Please consider the investment objectives, risks, charges and expenses of the fund carefully before investing. The prospectus and the summary prospectus contain this and other information about the Fund. To obtain a prospectus or a summary prospectus, contact your financial professional or download and/or request one on the resources section or call Touchstone at 800-638-8194. Please read the prospectus and/or summary prospectus carefully before investing.
Touchstone Funds are distributed by Touchstone Securities, Inc.
A registered broker dealer and member FINRA/SIPC.
Not FDIC Insured | No Bank Guarantee | May Lose Value