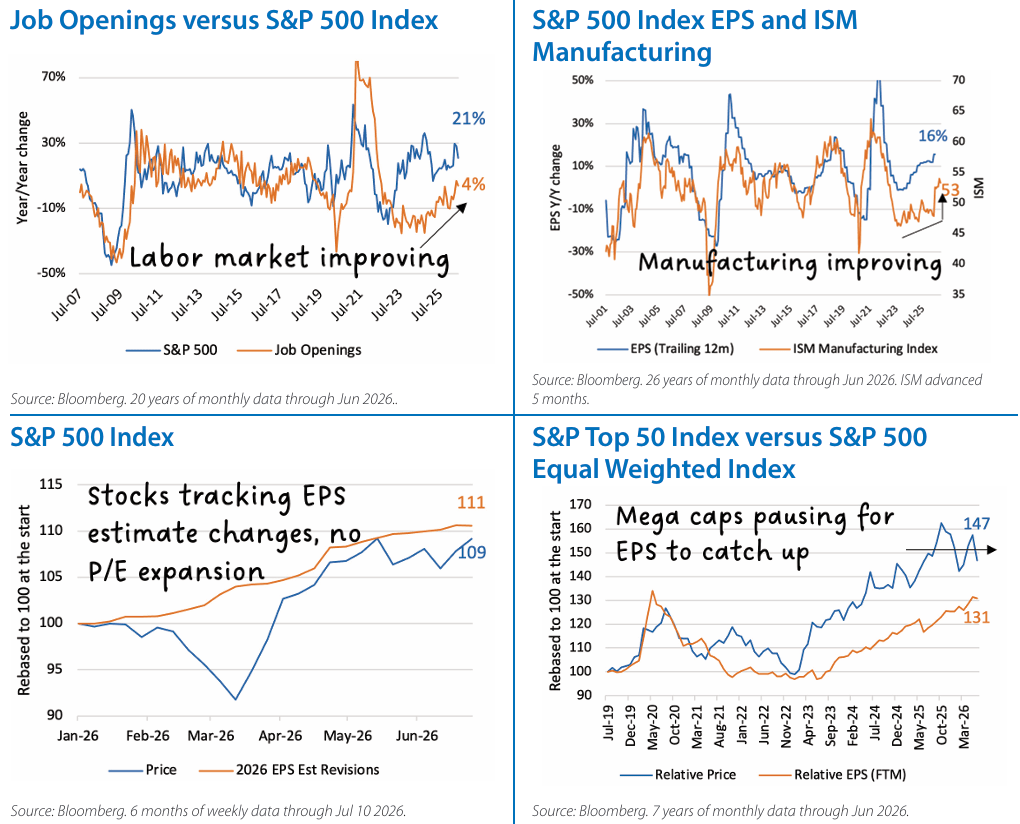
- Our constructive outlook toward U.S. large cap equities remains intact. Economic data continue to point toward expansion rather than contraction, while earnings expectations have continued to improve despite geopolitical uncertainty.
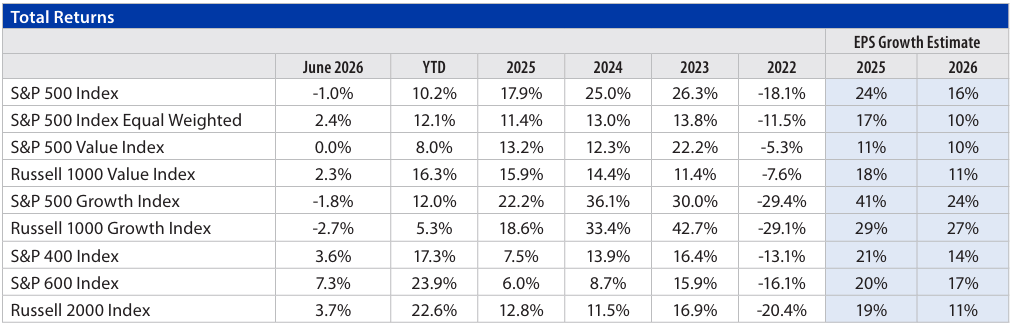
- First quarter’s earnings growth was among the strongest seen outside of recession recoveries, and the second quarter is expected to be equally strong, with analysts forecasting approximately 23% year/year earnings growth for the S&P 500. Analysts continue to raise earnings estimates for both 2026 and 2027. Importantly, earnings revisions have outpaced stock price appreciation.
- Although market participation has broadened, leadership remains unusually dependent on one spending driver as companies tied directly or indirectly to AI spending account for a disproportionate share of earnings growth and index performance. While a single market driver alone does not end bull markets, it can contribute to higher volatility.
- Economic data has become somewhat more balanced. Manufacturing activity remains in expansion, labor market conditions have moderated but remain healthy, retail spending has proven resilient, and inflation has eased from recent highs.
- Risks remain. Inflation, Fed policy and geopolitical developments continue to create periods of volatility. Hawkish comments from the new Fed Chair have pushed interest rates higher. While higher rates could create near-term volatility, we believe earnings growth remains the more important driver of long-term equity returns.
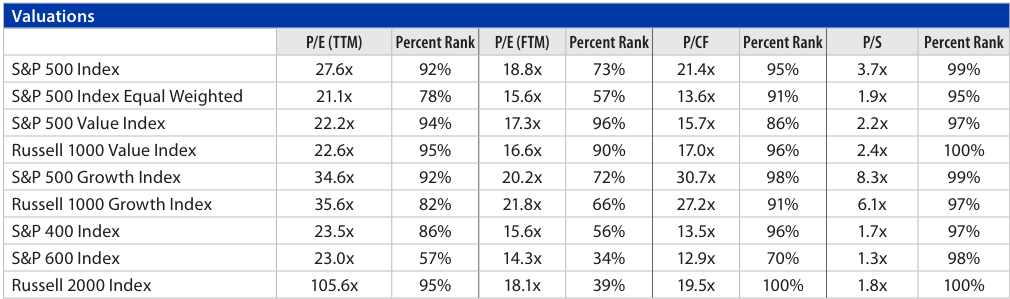
- We continue to believe the secular bull market remains intact. Strong earnings momentum, resilient economic activity, and broadening AI-related investment support our constructive outlook, although periods of consolidation should be expected given elevated valuations and concentrated leadership.
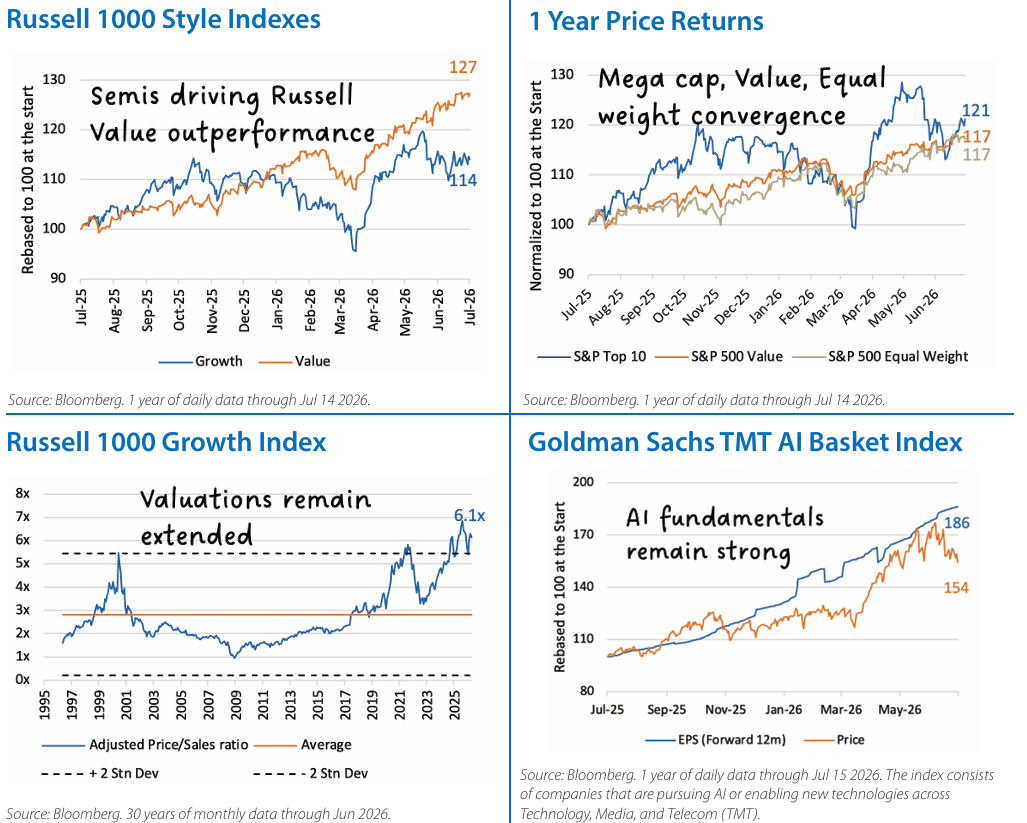
- We remain near our strategic allocations between Value and Growth, although recent performance has become more nuanced than headline style returns suggest. While both styles continue to benefit from a supportive earnings backdrop, we do not currently see a compelling reason to meaningfully favor one over the other.
- Second-quarter bank earnings reinforced our constructive view of the broader economy. Credit quality remained healthy, consumer spending continued to prove resilient, commercial activity showed signs of improvement, and management commentary increasingly focused on AI-driven productivity opportunities rather than simply technology spending.
- An interesting divergence has emerged between the major style benchmarks. The S&P 500 Growth Index has outperformed the S&P 500 Value Index this year, while the Russell 1000 Value Index has outperformed Russell 1000 Growth.
- The primary explanation lies in index construction rather than changing fundamentals. The S&P style indexes allocate a greater portion of the Mag 7 in the Value index than Russell. Because several Mag 7 stocks have lagged this year, they created a larger headwind for the S&P Value Index. At the same time, the Russell 1000 Value index benefited from strong performance in semiconductor holdings such as Micron Technology, AMD, and SanDisk before they graduated out of the Value index during June’s annual reconstitution. Following the reconstitution, Russell Value has a meaningfully different composition, with Amazon, Apple, and Microsoft now the top holdings.
- Longer term, we believe Value's greatest opportunity lies in AI adoption rather than AI construction. Financials, health care and industrial companies increasingly appear positioned to benefit from productivity improvements as AI moves beyond infrastructure spending into enterprise deployment. This aligns with our view that the next phase of AI will be defined less by who builds the technology and more by who uses it most effectively.
- While AI remains the dominant market theme, we continue to favor a balanced approach between Growth and Value.
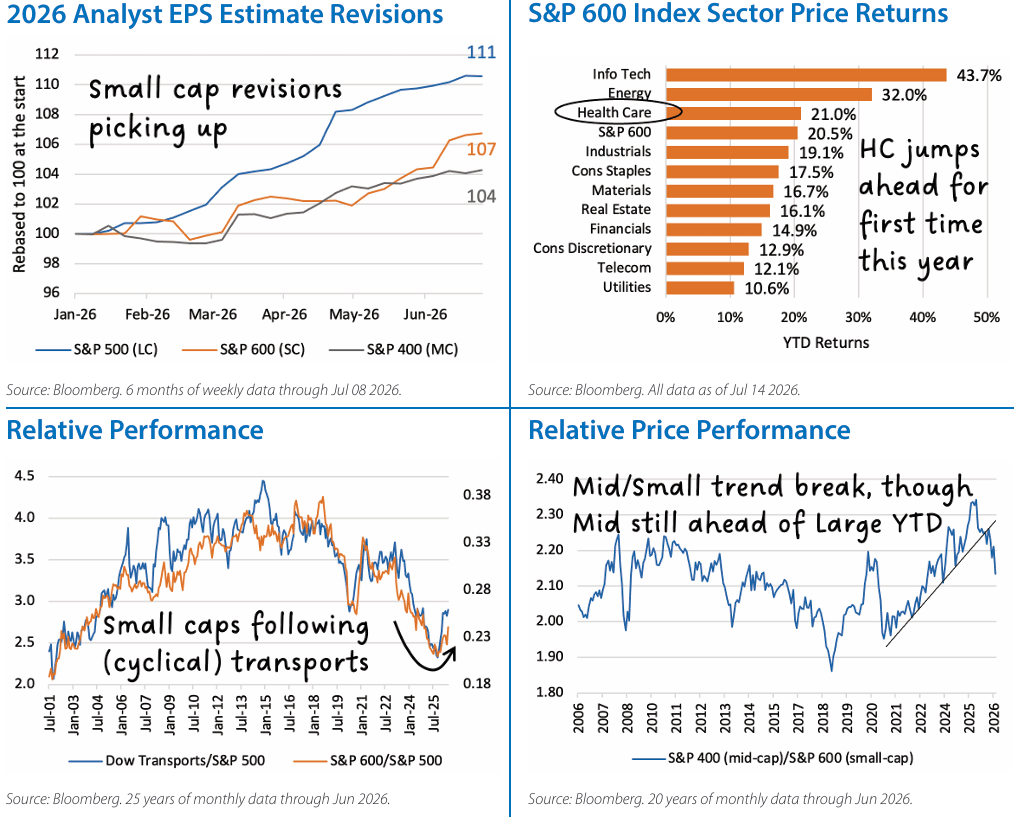
- We continue to monitor improving fundamentals within small and mid cap companies, although relative performance has softened during July following an exceptionally strong first half. Renewed geopolitical tensions and higher oil prices have temporarily shifted leadership back toward larger, more defensive companies.
- As discussed in our Midyear Update, we believe AI will eventually enter a new phase in which companies that successfully deploy AI may become larger beneficiaries than those simply building the infrastructure. Smaller companies may have more opportunity to improve productivity because labor costs represent a larger share of their expense base and AI can help reduce long-standing scale disadvantages.
- The Russell 2000 index underwent one of its largest annual reconstitutions on record, with nearly 16% of the index’s market cap leaving as many of the index's strongest performers graduated into the Russell 1000. Historically, this creates a temporary headwind for passive small cap indexes. Going forward, Russell is moving to a semiannual reconstitution, which should make future index changes less disruptive.
- Mid caps have recently trailed small caps despite similar earnings growth expectations for 2026. While the divergence is notable, we believe it is too early to draw meaningful conclusions. One difference has been earnings revisions, where estimates for small caps have improved modestly more than mid caps. While the divergence is small, it suggests investors are placing greater weight on improving expectation than on the level of expected earnings growth.
- We continue to monitor earnings revisions closely. Improving estimates, resilient consumer spending and continued business investment would provide greater confidence that leadership can broaden beyond today's narrow group of AI infrastructure beneficiaries. We note that healthcare stocks have significantly outperformed in the last two months.
- While small caps have demonstrated improving momentum, we continue to monitor financial conditions closely. Smaller companies remain more sensitive to interest rates than large caps, making Fed policy an important determinant of relative performance.
Equity Indexes Characteristics
The Indexes mentioned are unmanaged statistical composites of stock market or bond market performance. Investing in an index is not possible.
Glossary of Investment Terms and Index Definitions
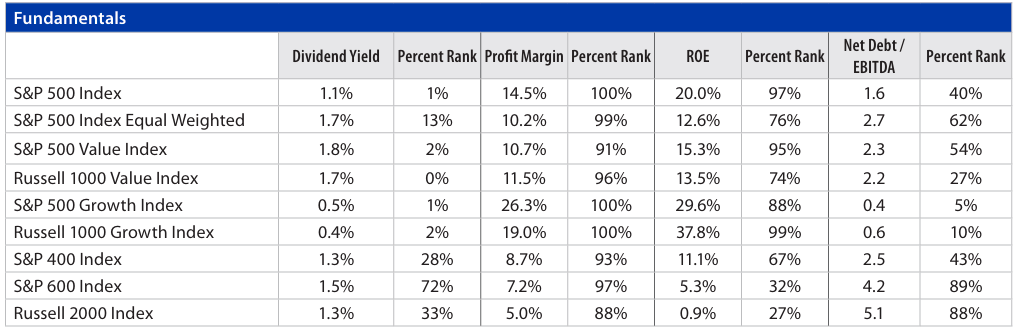
Source: Bloomberg. Percent ranks are based on 30 years of monthly data as of the end of June; EPS growth estimates based on consensus bottom-up analyst estimates
The Touchstone Asset Allocation Committee
The Touchstone Asset Allocation Committee (TAAC) consisting of Crit Thomas, CFA, CAIA – Global Market Strategist, Erik M. Aarts, CIMA – Vice President and Senior Fixed Income Strategist, and Tim Paulin, CFA – Senior Vice President, Investment Research and Product Management, develops in-depth asset allocation guidance using established and evolving methodologies, inputs and analysis and communicates its methods, findings and guidance to stakeholders. TAAC uses different approaches in its development of Strategic Allocation and Tactical Allocation that are designed to add value for financial professionals and their clients. TAAC meets regularly to assess market conditions and conducts deep dive analyses on specific asset classes which are delivered via the Asset Allocation Summary document. Please contact your Touchstone representative or call 800.638.8194 for more information.
A Word About Risk
Investing in fixed-income securities which can experience reduced liquidity during certain market events, lose their value as interest rates rise and are subject to credit risk which is the risk of deterioration in the financial condition of an issuer and/or general economic conditions that can cause the issuer to not make timely payments of principal and interest also causing the securities to decline in value and an investor can lose principal. When interest rates rise, the price of debt securities generally falls. Longer term securities are generally more volatile. Investment grade debt securities which may be downgraded by a Nationally Recognized Statistical Rating Organization (NRSRO) to below investment grade status. U.S. government agency securities which are neither issued nor guaranteed by the U.S. Treasury and are not guaranteed against price movements due to changing interest rates. Mortgage-backed securities and asset-backed securities are subject to the risks of prepayment, defaults, changing interest rates and at times, the financial condition of the issuer. Foreign securities carry the associated risks of economic and political instability, market liquidity, currency volatility and accounting standards that differ from those of U.S. markets and may offer less protection to investors. Emerging markets securities which are more likely to experience turmoil or rapid changes in market or economic conditions than developed countries.
Performance data quoted represents past performance, which is no guarantee of future results. The investment return and principal value of an investment in the Fund will fluctuate so that an investor’s shares, when redeemed, may be worth more or less than their original cost. Current performance may be higher or lower than performance data given. For performance information current to the most recent month-end, visit TouchstoneInvestments.com/mutual-funds.
Please consider the investment objectives, risks, charges and expenses of the fund carefully before investing. The prospectus and the summary prospectus contain this and other information about the Fund. To obtain a prospectus or a summary prospectus, contact your financial professional or download and/or request one on the resources section or call Touchstone at 800-638-8194. Please read the prospectus and/or summary prospectus carefully before investing.
Touchstone Funds are distributed by Touchstone Securities, LLC*
*A registered broker-dealer and member FINRA/SIPC.
Touchstone is a member of Western & Southern Financial Group
Not FDIC Insured | No Bank Guarantee | May Lose Value