In this section, we include charts and concepts that are not necessarily thematic in nature and may, at times, even be in contrast to our own views. Some of these charts are sourced from our sub-advisors who allow for differentiated insight into a variety of asset classes on a global scale. Others we have sourced ourselves as we find them compelling and may reflect views that are somewhat unique and may not be emphasized by the financial media.
Phase Shift
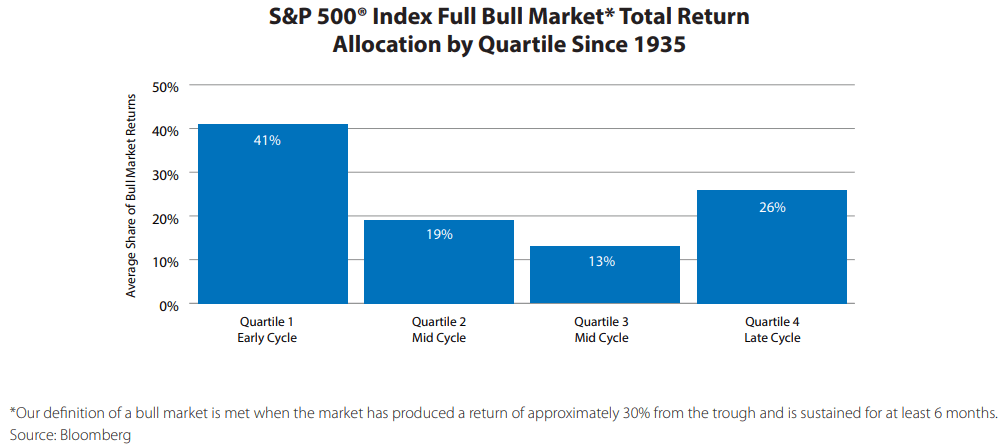
This cycle is unique and difficult to characterize. It has also moved at a very rapid pace. We use a number of economic signals to help gauge where we are in the cycle, and today, those signals cover the gambit, from very early cycle, to late cycle, and many in between. Our Economic Cycle Model suggests we have moved into the late cycle. Signs such as an inverted yield curve and even characteristics of the market rally off October 2022 lows are consistent with the late cycle. We don’t believe this rally is the start of a new bull market. Possibly, it is a rally within an extended bear market, or, after pandemic interruption, we are back at the late cycle conditions of 2019.
The Search for Yield
When trying to understand current low Treasury yields, we explored a number of different fundamental Treasury models. The Model below has been historically robust. It is important to recognize that the unique circumstances surrounding the pandemic could mean this historically derived Model is currently less informative. Our bond yield model has moved up with 2-year Treasury yields and inflation. It appears the 10-year bond yield may have peaked, as our model has not made new highs.

*Model based on: Core CPI, Unemployment Rate, Federal Funds Rate, 2-year Treasury yield. Source: Bloomberg
The relative yield gain from moving out the credit spectrum doesn’t appear that attractive given tight monetary policy conditions and increased risk of economic slowing. We are putting more emphasis on higher quality credit.
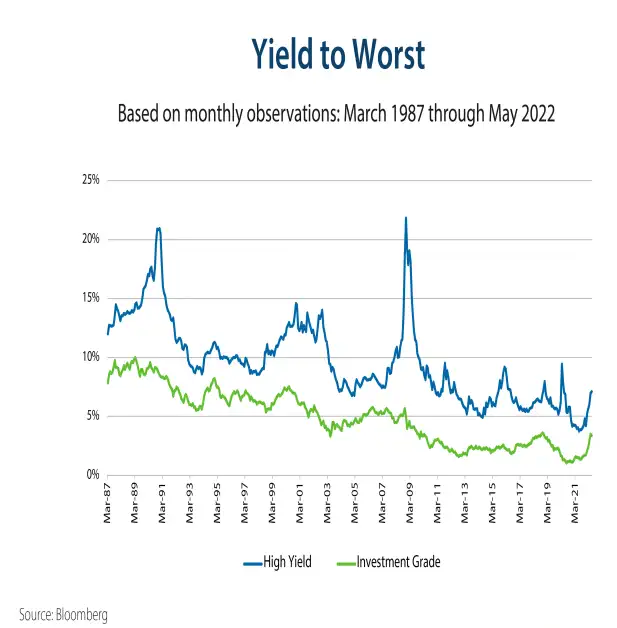
Source: Bloomberg
Active Versus Passive
While the S&P 500® Index has outperformed the MSCI EAFE® and Emerging Markets indexes over the last cycle, international stocks still represent a healthy hunting ground for active managers given the consistently high representation in the top 100 performing stocks.
The weight of the top 10 stocks in the S&P 500® Index reached a new high in September of 2020, representing 34% of the Index’s market cap. With the top 10 stocks accounting for most all of the performance year-to-date, it is not surprising that their weight in the index has increased.

*For the following indexes: S&P 500®
Index, MSCI EAFE®, MSCI Emerging Markets, the top 100 represents the stocks
with the highest total return in each year. Source: Bloomberg
Valuations Around the World
As a reference, we provide valuation measures for various domestic and international indexes. The valuation range dates back to 1996.

* The minimum and maximum ranges are set
to the 5th and 95th percentiles, respectively, to remove outliers.
Sources:
Bloomberg, MSCI, S&P, Dow Jones Indexes
The Mid-Cap Gap
Mid cap earnings rebounded relative to large cap, but they have yet to pull relative prices up with them. It is important to note that this relative underperformance year-to-date is simply a function of the strength of the top stocks in the S&P 500®. The S&P 400® Index has outperformed the equal weighted S&P 500® Index to-date through August. The mid-cap index earnings have been mainly helped by less international exposure.
Looking at valuations, historically current low valuations have led to healthy longer term returns.

*Normalization adjusts or rescales the
values of different time series to a notionally common scale to allow for
comparability.
Source: Bloomberg.
Small and Mid-Cap Valuations
Small and Mid-Cap valuations appear very attractive versus history based on the S&P Indexes.
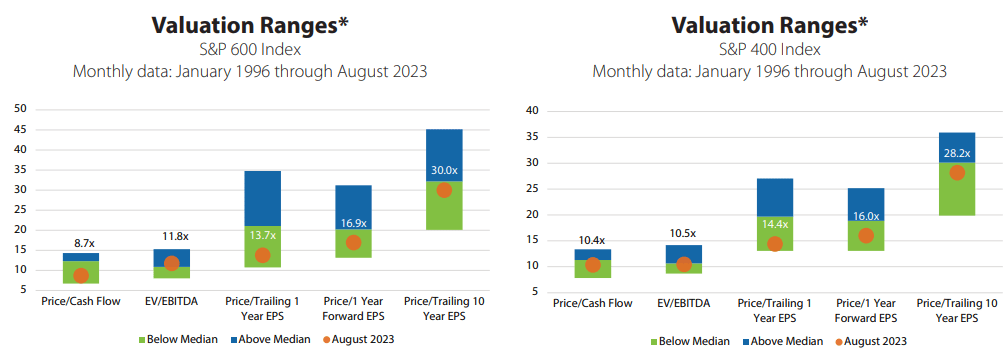
*Based on monthly data starting in 1996. The minimum and maximum ranges are set to the 5th and 95th percentiles, respectively, to remove outliers.
Source: Bloomberg
Glossary of Investment Terms and Index Definitions
This commentary is for informational purposes only and should not be used or construed as an offer to sell, a solicitation of an offer to buy, or a recommendation to buy, sell or hold any security. There is no guarantee that the information is complete or timely. Past performance is no guarantee of future results. Investing in an index is not possible. Investing involves risk, including the possible loss of principal and fluctuation of value. Please visit touchstoneinvestments.com for performance information current to the most recent month-end.
Please consider the investment objectives, risks, charges and expenses of the fund carefully before investing. The prospectus and the summary prospectus contain this and other information about the Fund. To obtain a prospectus or a summary prospectus, contact your financial professional or download and/or request one on the resources section or call Touchstone at 800-638-8194. Please read the prospectus and/or summary prospectus carefully before investing.
Touchstone Funds are distributed by Touchstone Securities, Inc.*
*A registered broker-dealer and member FINRA/SIPC.
Not FDIC Insured | No Bank Guarantee | May Lose Value