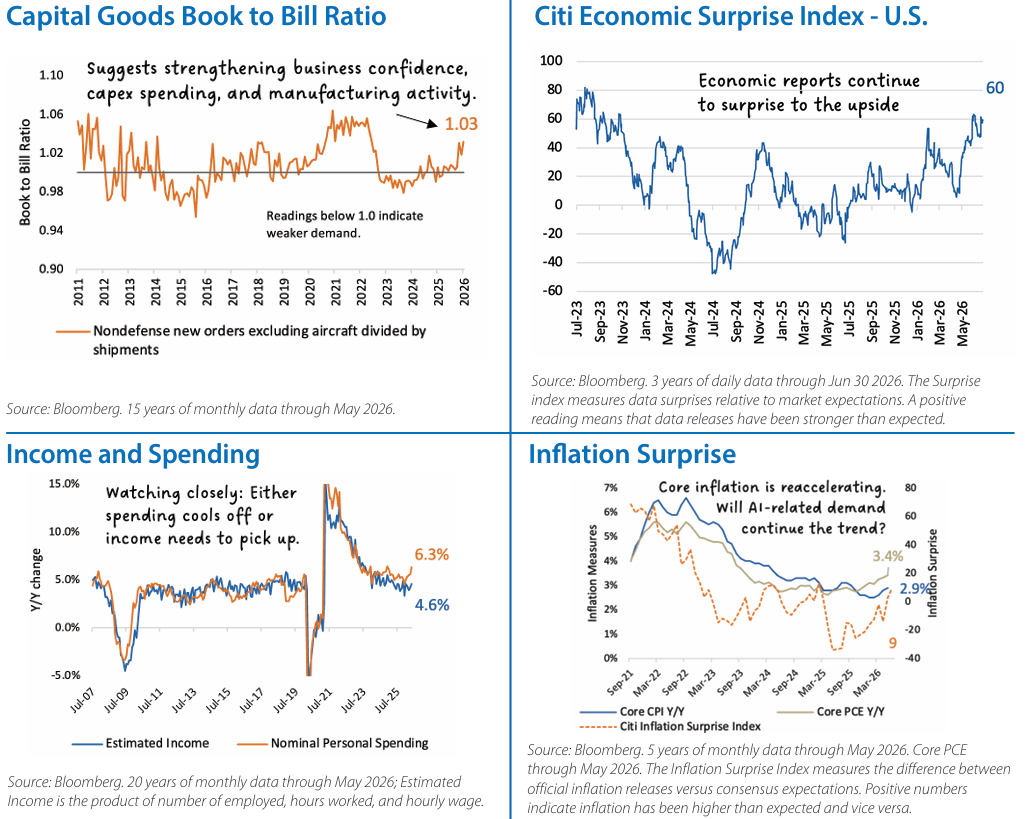
- Resilience Continues to Surprise: Economic resilience remains the defining story of 2026. Recent employment reports show non-farm payrolls rising while the unemployment rate holds steady at a low rate. Retail sales have surged, and first quarter GDP was revised higher to above 2% annualized. Continued business investment, particularly in semiconductors, data centers, power infrastructure, and related AI initiatives, has offset softer consumer spending and kept economic growth on solid footing despite elevated interest rates. While supportive of corporate fundamentals, resilience has reversed the need for the Federal Reserve to ease monetary policy.
- Inflation Risks Are Evolving: Inflation became more nuanced during June. The Fed's preferred inflation measure, Core PCE, accelerated to 3.4% year over year as higher energy prices began filtering through the broader economy. Beyond energy, investors are increasingly focused on whether the unprecedented wave of AI-related capital spending creates a broader demand shock as investment in semiconductors, power infrastructure, electrical equipment, and construction strains supply chains and pushes prices higher. At the same time, easing tensions in the Middle East and lower oil prices have helped moderate inflation expectations, leaving markets to balance near-term inflation risks against improving longer-term fundamentals.
- Consumers Remain Bifurcated: The U.S. consumer remains resilient in aggregate but bifurcated beneath the surface. Affluent households continue to support discretionary spending, while middle and lower-income consumers remain focused on value and necessities. Even though real wage growth has materially slowed, a stable labor market has prevented this pressure from spilling over into broader economic weakness.
- Growth Supports Tactical Changes: TAAC's June allocation change reflects growing confidence in the economy's resilience rather than diminished conviction in fixed income. We modestly reduced fixed income and increased U.S. equities as stable employment data, improving earnings prospects, and a broadening AI investment cycle enhanced the relative risk-reward outlook for equities while leaving the case for high-quality bonds intact.
- Policy Takes Center Stage: The result is a constructive but increasingly policy sensitive backdrop. Economic growth remains resilient, inflation risks have become more nuanced, and monetary policy is once again the primary driver of market expectations as investors weigh stronger growth against evolving inflation dynamics.
- Income Cushion Remains Strong: Bond returns have held up better than many expected despite the Federal Reserve's increasingly hawkish tone. Higher starting yields have helped offset price weakness, while investment-grade corporates and securitized sectors have outperformed Treasuries. This reinforces TAAC's preference for high-quality spread sectors and a slight duration overweight, even after reducing our overall tactical fixed income allocation in favor of equities.
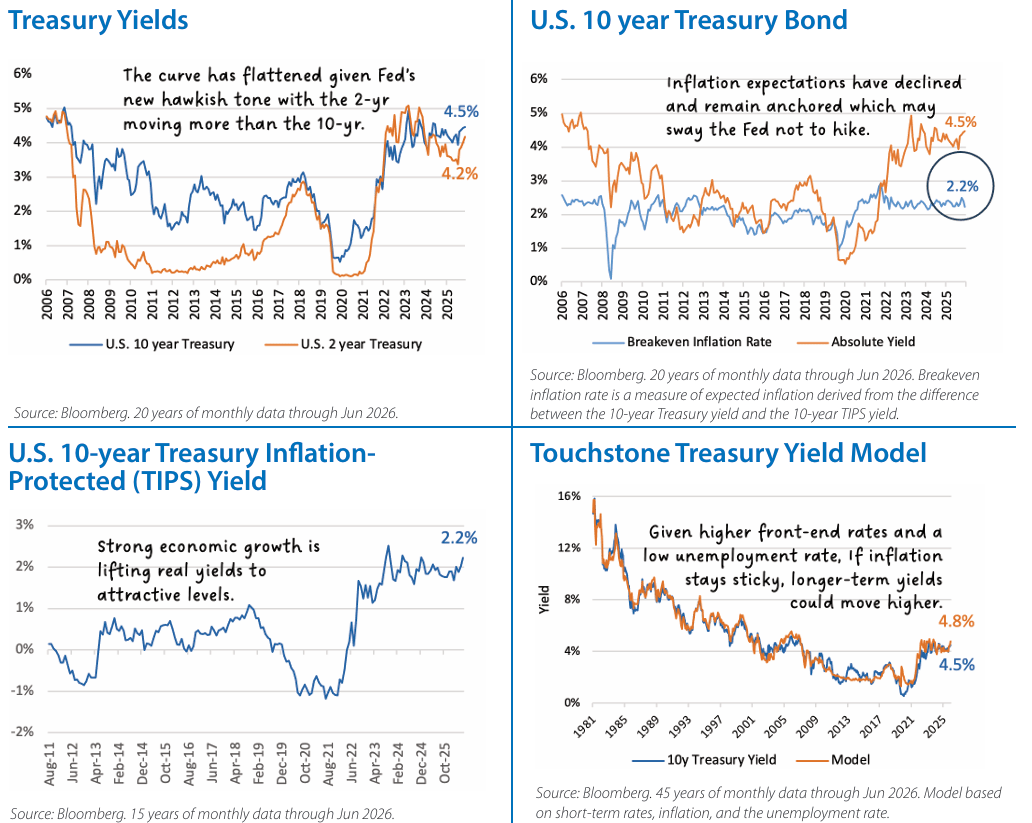
- Real Yields Offer Opportunity: Higher Treasury yields increasingly reflect stronger real growth rather than unanchored inflation expectations. Resilient consumer spending, AI-related investment, and healthy corporate fundamentals have lifted real yields to some of the highest levels in nearly two decades. Historically attractive real yields improve prospective long-term return potential, while elevated nominal yields provide investors with a meaningful income cushion against continued interest-rate volatility.
- A New Chair, A New Tone: Kevin Warsh's first FOMC meeting reinforced the Committee's inflation fighting credibility through a more hawkish tone, a streamlined policy statement emphasizing price stability, and updated projections that shifted the expected policy path higher. While the June meeting largely followed the Federal Reserve's traditional playbook, it also marked the beginning of a broader review of how monetary policy is communicated and implemented.
- The Fed's Next Chapter: The greater uncertainty lies ahead. Warsh has established five task forces to review Fed communications, balance sheet policy, data sources and analytical frameworks, AI-related productivity and labor markets, and inflation measurement. As these recommendations are developed and implemented, investors may face greater interest rate volatility while markets adjust to the Fed's evolving reaction function. Over time, a less prescriptive communication approach could allow market expectations and financial conditions to respond more directly to incoming economic data, reducing the need for policymakers to rely as heavily on forward guidance.
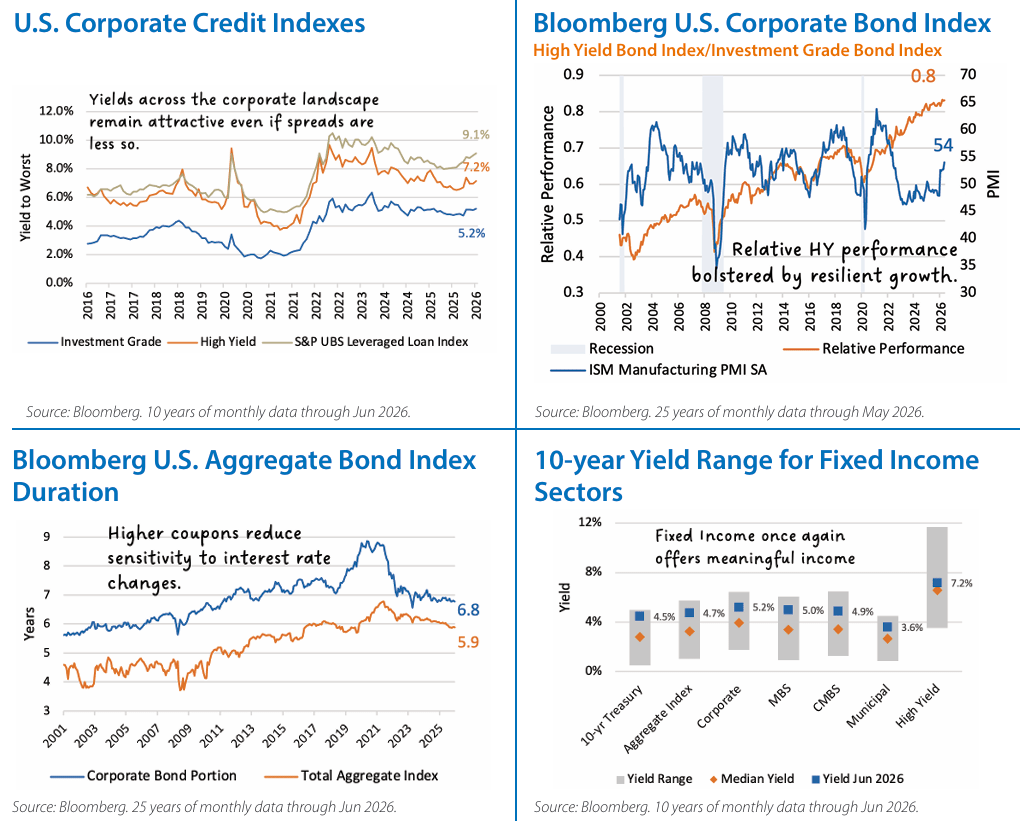
- Income Is Back: While interest rate volatility may increase during this transition, today's bond market offers something investors lacked for much of the past decade: meaningful income. TAAC continues to emphasize the intermediate portion of the yield curve and higher-quality corporate and securitized credit, where elevated yields provide attractive income, improved forward return potential, and an important source of portfolio diversification and stability.
- Healthy Fundamentals, Greater Selectivity: Credit markets remain supported by resilient economic growth, healthy corporate earnings, and relatively low default activity. While these fundamentals remain constructive, months of broad spread compression have left valuations increasingly full, providing limited compensation for additional credit risk and leaving less room for error. As a result, TAAC maintains a moderate underweight to below-investment-grade bonds while emphasizing disciplined security selection over broad market exposure.
- AI Reshaping Credit Markets: Artificial intelligence is increasingly becoming a fixed income story. Financing the buildout of data centers, power infrastructure, networking, utilities, industrial facilities, and digital infrastructure is driving issuance across investment-grade corporates, high yield, private credit, and securitized markets. As companies increasingly rely on debt markets to fund this investment cycle, the expanding primary market is improving price discovery and creating more opportunities for investors to evaluate new transactions and financing structures. Active managers are increasingly able to distinguish between issuers building durable competitive advantages and those unlikely to earn adequate returns on rapidly expanding capital investment.
- Securitized Credit Offers Advantage: Securitized credit continues to offer attractive income supported by structural credit enhancement and strong underlying collateral. Prime residential mortgages continue to benefit from substantial homeowner equity built over recent years, while consumer credit performance remains increasingly bifurcated, with stress largely concentrated among lower-income borrowers and lower-quality collateral. We continue to find seasoned non-agency RMBS and higher-quality asset-backed securities particularly attractive for their combination of income and downside protection.
- Emerging Market Debt Is Differentiated: Local-currency emerging market debt is becoming increasingly attractive as many emerging market central banks remain ahead of their developed-market peers in addressing inflation. The broad opportunity set extends well beyond below-investment grade debt, with higher real yields, more orthodox monetary policy, and increasingly differentiated country fundamentals reinforcing the value of active management.
- Active Management Matters More: The combination of resilient fundamentals, historically tight spreads, and a rapidly evolving opportunity set reinforces the value of active management. In today's market, excess return is increasingly driven by security selection and identifying durable sources of income rather than broad exposure to credit beta.
Fixed Income Indexes Characteristics
The Indexes mentioned are unmanaged statistical composites of stock market or bond market performance. Investing in an index is not possible.
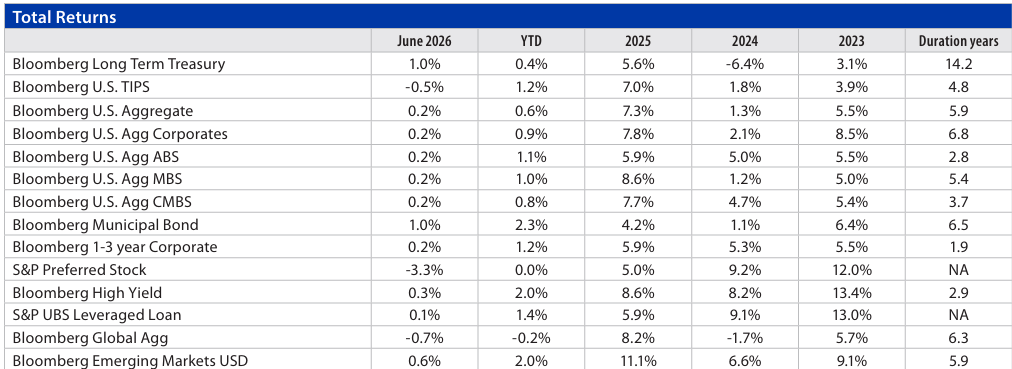
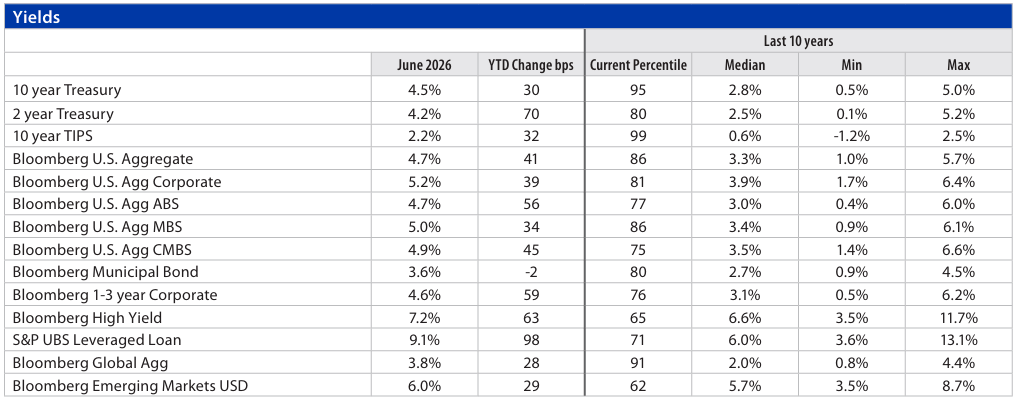
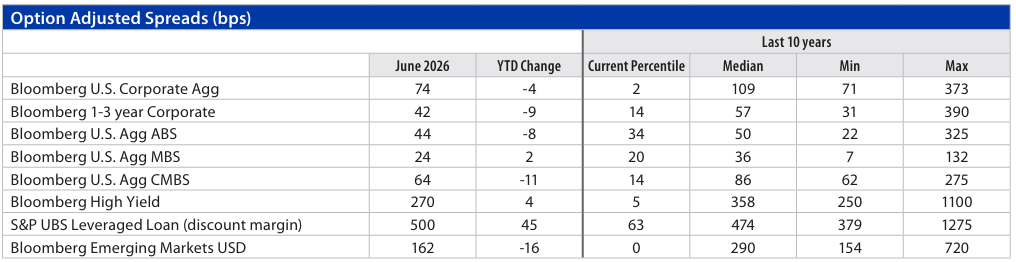
For Index Definitions see: TouchstoneInvestments.com/insights/investment-terms-and-index-definitions
2024 – Economic growth continued unabated, driven by consumer spending. Inflation moderated further. The Federal Reserve pause continued until September, after which it cut interest rates three times by a total of 1 percentage point. Bond yields rose in response, resulting in only modest gains for high quality fixed income but better returns for riskier areas of fixed income.
2025 – The economy remained resilient, and inflation stayed sticky, keeping yields elevated but allowing high-quality intermediate maturity bonds to generate solid returns as the Fed cut rates late in the year. Steady growth and improving liquidity supported tighter spreads, driving performance in credit-sensitive areas of the fixed income market.
The Touchstone Asset Allocation Committee
The Touchstone Asset Allocation Committee (TAAC) consisting of Crit Thomas, CFA, CAIA – Global Market Strategist, Erik M. Aarts, CIMA – Vice President and Senior Fixed Income Strategist, and Tim Paulin, CFA – Senior Vice President, Investment Research and Product Management, develops in-depth asset allocation guidance using established and evolving methodologies, inputs and analysis and communicates its methods, findings and guidance to stakeholders. TAAC uses different approaches in its development of Strategic Allocation and Tactical Allocation that are designed to add value for financial professionals and their clients. TAAC meets regularly to assess market conditions and conducts deep dive analyses on specific asset classes which are delivered via the Asset Allocation Summary document. Please contact your Touchstone representative or call 800.638.8194 for more information.
A Word About Risk
Investing in fixed-income securities which can experience reduced liquidity during certain market events, lose their value as interest rates rise and are subject to credit risk which is the risk of deterioration in the financial condition of an issuer and/or general economic conditions that can cause the issuer to not make timely payments of principal and interest also causing the securities to decline in value and an investor can lose principal. When interest rates rise, the price of debt securities generally falls. Longer term securities are generally more volatile. Investment grade debt securities which may be downgraded by a Nationally Recognized Statistical Rating Organization (NRSRO) to below investment grade status. U.S. government agency securities which are neither issued nor guaranteed by the U.S. Treasury and are not guaranteed against price movements due to changing interest rates. Mortgage-backed securities and asset-backed securities are subject to the risks of prepayment, defaults, changing interest rates and at times, the financial condition of the issuer. Foreign securities carry the associated risks of economic and political instability, market liquidity, currency volatility and accounting standards that differ from those of U.S. markets and may offer less protection to investors. Emerging markets securities which are more likely to experience turmoil or rapid changes in market or economic conditions than developed countries.
Performance data quoted represents past performance, which is no guarantee of future results. The investment return and principal value of an investment in the Fund will fluctuate so that an investor’s shares, when redeemed, may be worth more or less than their original cost. Current performance may be higher or lower than performance data given. For performance information current to the most recent month-end, visit TouchstoneInvestments.com/mutual-funds.
Please consider the investment objectives, risks, charges and expenses of the fund carefully before investing. The prospectus and the summary prospectus contain this and other information about the Fund. To obtain a prospectus or a summary prospectus, contact your financial professional or download and/or request one on the resources section or call Touchstone at 800-638-8194. Please read the prospectus and/or summary prospectus carefully before investing.
Touchstone Funds are distributed by Touchstone Securities, LLC*
*A registered broker-dealer and member FINRA/SIPC.
Touchstone is a member of Western & Southern Financial Group
Not FDIC Insured | No Bank Guarantee | May Lose Value