U.S. equity markets have undergone a historic rally after having fallen victim to the COVID-19 pandemic in the first quarter of 2020. While the wounds of 2008 – 2010 were still fresh in people’s minds, the move down as a result of the pandemic brought back the worst of memories. Following swift action from both the Federal Reserve and Congress, the market recovery began and has continued into the early stages of 2021.
The focus can now move to valuation. In particular, we must ask—are the equity markets overvalued? Depending upon the statistic (price to earnings, CAPE, price to book, price to sales, “intrinsic value,” “fair value,” or earnings yield), one can argue that some segments of the equity market are undervalued, some are at fair value, and some are overvalued. Perhaps surprisingly, in our view, the equity markets do not appear to be significantly overvalued when viewed holistically.
For those who believe that equity markets are overvalued, there is considerable risk in selling out of equities too early and missing positive returns. Two recent examples illustrate the challenge of making decisions based on valuation alone: 1) in July 1995, many began to sound the alarm that equities were historically expensive, yet the S&P 500 gained an additional 194% until March 2000; 2) Similarly, equities appeared overvalued in December 2016 and then rallied 61% until February 19, 2020, before the pandemic began to hurt U.S. equities.
A Brief History of Bull and Bear Markets

As the United States moved from being primarily a manufacturing-based economy to more of a service-based economy, U.S. companies became more profitable, and those profits became more stable and predictable. The cyclicality of manufacturing was replaced by what at times has been called, “The great moderation.” The economy became less cyclical, earnings became more persistent, and stock prices went up. The result has been two bull markets that, in size, dwarf any preceding bull market since 1929.
The changes in the U.S. economy and U.S. corporations have impacted market behavior. Bear markets are generally no longer caused by traditional cyclical factors but are caused by other factors such as over-valuation, credit issues (crisis), or exogenous events (pandemics). The last three bear markets—the technology bubble, the mortgage crisis, and the COVID-19 pandemic—are evidence of events that disrupt bull markets. These types of events are what worry us most.
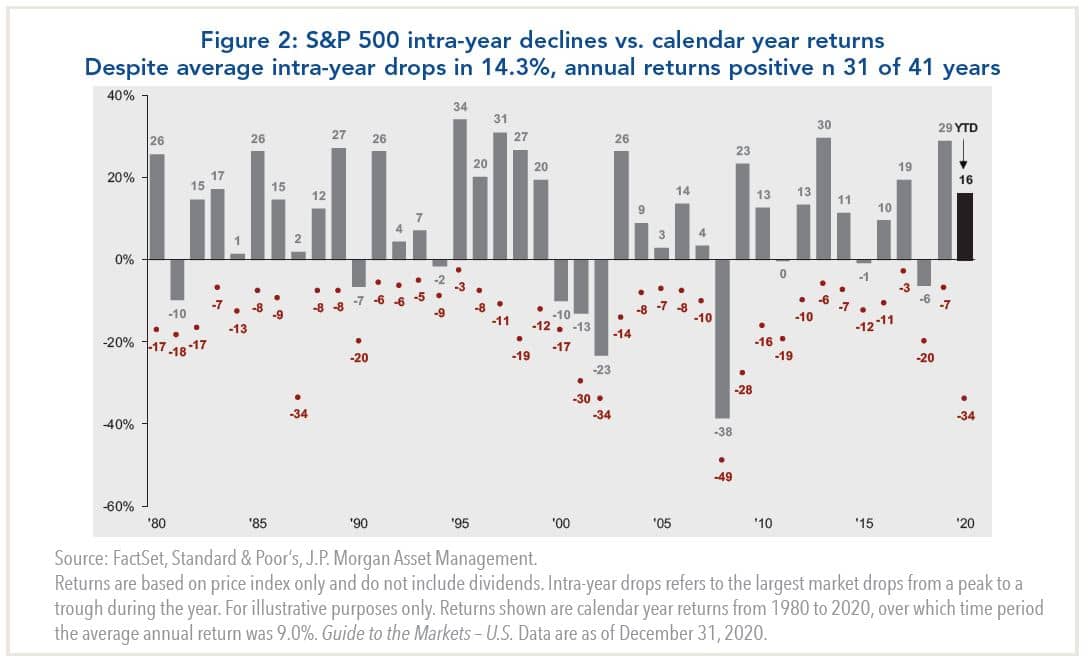
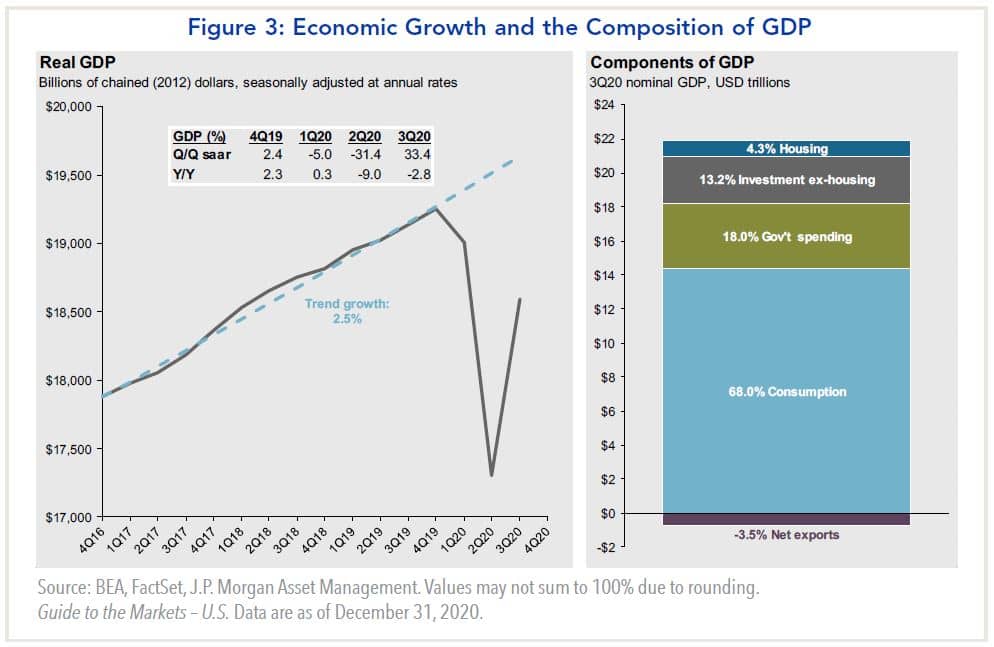
Figure 2 shows the S&P 500 intra-year declines along with the annual returns for the index. The after effects of the technology (valuation) bubble lasted 3 years while the housing crisis, which lasted only a year, was the most severe. The market recovered its losses from the COVID-19 pandemic in historic fashion with the S&P 500 down 34% early in 2020 only to finish the year up 18.4%. As evidenced in Figure 3, the economy contracted by over 10% in early 2020. Timely action by the Federal Reserve along with added fiscal stimulus, however, created an environment in which many businesses survived, and in some cases, thrived. The adoption of new technologies (e.g., Zoom), helped companies post better earnings than initially expected in such a difficult year.
But, shouldn’t we worry about valuation? And what about potential tax hikes? We believe that market timing based on political events is not fruitful, and we offer the chart showing the growth of $10,000 over previous presidential administrations as a guide (Figure 4). Since 1937, the trend of the market has been up despite which political party has been in control of the White House or Congress. As is always the case in equity investing, it is less about timing the market and more about time in the market. We believe that for those with a long time horizon, equity investing is most rewarding. Trying to handicap the effects of a given political environment is not an endeavor we recommend. Valuation, while very important when selecting individual stocks, should not be used in an attempt to time the market (see chart titled “P/E Ratios and Equity Returns,” Figure 5). Subsequent one year forward returns for a given P/E ratio can vary substantially.


Looking Ahead
In summary, it is our belief that political changes are not generally market moving, the economy should strengthen with wider distribution of the COVID vaccine, and corporate earnings should continue to rise. We will keep a watchful eye on policies coming from the new administration (especially tax policies) and will continue to be mindful of the pandemic, but as it stands today, we are confident in the prospects for the equity market.