We believe:
- Small cap stocks are an inefficient asset class that have the potential to generate attractive long-term returns.
- Capitalizing on the inefficiencies of the asset class requires the consistent application of a differentiated investment philosophy.
- Equities experience four investment cycle stages, and fundamental analysis should be tailored to each stage.
- Minimizing downside risk must be a priority to realize the full potential of an allocation to small cap stocks.
Exploiting Inefficiencies
We believe small cap stocks are an inefficient asset class and that the key to capitalizing upon these inefficiencies is through the application of a consistent, differentiated approach that focuses on minimizing downside risk.
Inefficiencies in the asset class are generally due to a shorter-term focus on current business trends and industry conditions, which can create a disconnect with the long-term fundamental market valuation of the business. In particular, there generally is a significant disconnect when a business model has the potential to inflect to a higher rate of growth and profitability than the market expects. Moreover, this asset class has less analyst coverage, low liquidity, capacity constraints, and volatility.
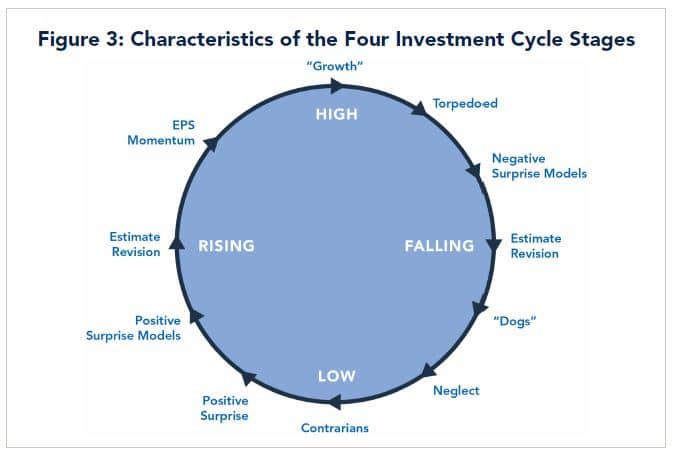
The Small Company Equity team at Fort Washington has a differentiated approach designed to capitalize on these inefficiencies, which centers on evaluating and researching stocks in the context of four investment cycle stages. Our objective is to capture the positive long-term returns of investing in small cap stocks while minimizing the volatility inherent in the asset class.
Our belief that equities experience a four stage investment cycle drives this research process, which focuses on the dynamics that apply to each stage.1 Analysis is tailored to each stage of this investment cycle, seeking to identify disconnects between current fundamentals, future expectations, and market valuations.
Breaking Down the 4 Stages: Research Focus
We define the first stage of the investment cycle as including companies where the market has low expectations. These stocks tend to be out of favor and have discounted valuations. The key to investing in “stage one” stocks is that while the majority of investors find the company unattractive with a backward looking view, our analysis develops conviction in the stability of the business model.
Once companies have exhibited stability in the business model, it is critical to identify whether they have the ability to improve the business model and move to the second stage of the investment cycle, characterized by rising expectations. Research here seeks to identify sustainable business model improvements to drive upside potential over their investment horizon.
Our objective is to initiate and add to positions in the first and second stage of the investment cycle, where we have conviction in the stability of the business model that will provide us downside protection and a thesis for why there will be a sustainable improvement in the business model leading to rising expectations (stage three). Conviction in the business model is generated by first conducting an industry stability assessment, both on the supply side competitive dynamics and demand side secular/cyclical growth trends. We believe that industry dynamics dictate the range of potential business model changes for a company. Therefore, the team must be confident industry conditions are stable.
The next step focuses on company analysis and includes financial statement analysis, as well as evaluation of management experience, strategy, and execution. This will involve a conference call or in-person meetings. Then, we combine our industry and company analysis to form our investment thesis, centered on four primary business model factors:
- Revenue growth
- Profit margin
- Free cash flow conversion
- Capital deployment expectations
Next, we apply relative and target valuations to our business model forecasts. The resulting list of investment candidates have the potential to generate long-term outperformance and move to the third stage of the investment cycle.
In the third stage, companies are operating near peak potential and have fundamentally high expectations. The vast majority of the market recognizes the positive attributes of these companies, which is reflected in a high valuation. The focus of our research for stage three companies is to monitor critical business model trends with a goal of maximizing returns while maintaining the discipline to respond to negative changes since there is limited downside protection from a valuation perspective. A corporate strategy change or deceleration in critical business model factor trends could result in a reevaluation of the investment thesis and a sale of the position.
In the fourth and final stage, companies are experiencing falling expectations and should be avoided. These falling market expectations could be caused by either broken growth stocks that missed high expectations or broken value stocks whose business models are deteriorating. When a company enters the fourth stage, the research focus is on determining if the business model changes are transitory or permanent, with a goal of minimizing capital losses.
Summary
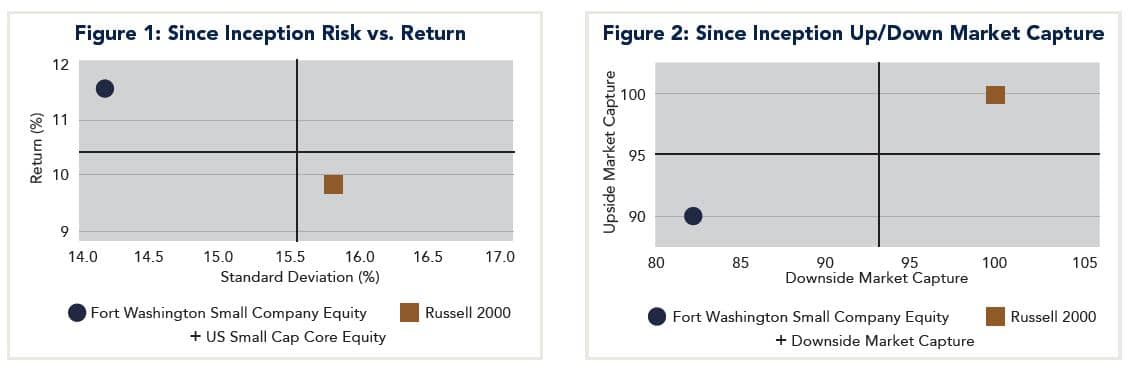
The Fort Washington Small Company Equity team seeks to drive successful investment outcomes through a differentiated approach, evaluating stocks in the context of four investment cycle stages and executing a consistent research approach that identifies positive business model changes. This approach has been in place since April 2013. Since that time, the strategy has regularly outperformed the benchmark Russell 2000 Index with lower downside volatility over various time periods, including the trailing three and five year periods.
Figure 1: Source: eVestment Alliance, LLC eASE Analytics US Small Cap Core Equity Universe. Inception Date: 4/1/13. Returns are presented gross of fees for illustrative purposes only and do not reflect the deduction of advisory fees. Returns will be reduced by the advisory fees and other expenses. For example, an advisory fee of 1% compounded over a 10-year period would reduce a 10% annual return to 8.9%. Upside/downside capture is measured against the US Small Cap Core Equity Universe peer group. Upside capture represents the average relative performance of Fort Washington’s Small Company Equity composite for all months when peer group returns were positive. Downside capture represents the average relative performance for all months when peer group returns were negative. Past performance is not indicative of future results. This supplemental information complements the Small Company Equity Composite Presentation. Russell Investment Group is the source and owner of the trademarks, service marks, and copyrights related to the Russell Indexes.
1 R. Bernstein, "The Earnings Expectations Life Cycle," Financial Analysts Journal, March-April 1993.
Figure 3: Graphic from R. Bernstein, "The Earnings Expectations Life Cycle," Financial Analysts Journal, March-April 1993. For informational purposes only. Information subject to change without notice.
| 2Q19 | YTD | 2018 | 2017 | |
|---|---|---|---|---|
| Small Company Equity (Gross) | 0.64% |
15.37% |
-7.44% |
18.75% |
| Small Company Equity (Net) | 0.56% | 15.19% | -7.73% | 18.34% |
| Russell 2000 Index | 2.10% | 16.98% | -11.01% | 14.65% |
| Small Company Equity 3-Year Annual Standard Deviation2 | - | - | 15.79% | 13.91% |
| Russell 2000 Index 3-YearAnnual Standard Deviation2 | - | - | 14.99% | 13.90% |
| Dispersions3 | - | - | - | - |
| Number of Accounts | <5 | <5 | <5 | <5 |
| Composite Assets ($ millions) | $1,161.2 | $1,161.2 | $1,114.9 | $1,295.3 |
| Composite % of Firm Assets | 2.04% | 2.04% | 2.26% | 2.45% |
| 2016 | 2015 | 2014 | 20131 | |
|---|---|---|---|---|
| Small Company Equity (Gross) | 20.71% | -0.41% | 7.71% | 20.52% |
| Small Company Equity (Net) | 20.29% | -0.76% | 7.33% | 20.21% |
| Russell 2000 Index | 21.31% | -4.41% | 4.89% | 23.52% |
| Small Company Equity 3-Year Annual Standard Deviation2 | 15.76% | - | - | - |
| Russell 2000 Index 3-YearAnnual Standard Deviation2 | 15.86% | - | - | - |
| Dispersions3 | - | - | - | - |
| Number of Accounts | <5 | <5 | <5 | <5 |
| Composite Assets ($ millions) | $1,147.8 | $907.5 | $1,073.1 | $1,374.4 |
| Composite % of Firm Assets | n/a | n/a | n/a | n/a |
12013 returns are a partial period from 4/1/13-12/31/13. Small Company Equity Composite inception date is 4/1/13 and the creation date is 1/1/18. 2The 3-Year annualized ex-post standard deviation is calculated using monthly returns to measure the average deviations of returns from its mean. 2013-2015 figures are not presented because 36 monthly returns are not available. 3Dispersion is not calculated for years in which the composite contains five portfolios or less. Dispersion is calculated as the equal weighted standard deviation of returns for those portfolios held in the composite during the entire period. All fee-paying, fully discretionary portfolios managed in the Small Company style, with a minimum of $3 million under management, are included in this composite. The Small Company Equity strategy fee schedule is as follows: 0.80% on the first $25 million, 0.75% on the next $25 million, and 0.70% on the balance for separate accounts. The Small Company Equity strategy seeks to invest primarily in common stocks of small-capitalization companies that Fort Washington believes are high quality, have superior business models, solid management teams, and are attractively values. The strategy normally invests at least 80% of its assets in small-capitalization companies. Fort this purpose, small capitalization companies are companies that have market capitalizations within the range represented in the Russell 2000 Index (between approximately $11 million and $7.7 billion as of September 30, 2018). The market cap range of the Russell 2000 Index will change with market conditions. The strategy may invest without limitation in foreign securities, although only where the securities are trading in the U.S. or Canada and only where trading is denominated in U.S. or Canadian dollars. The benchmark for this composite is the Russell 2000 Index. The Frank Russell Company (FRC) is the source and owner of the Russell Index data contained or reflected in this material and all trademarks and copyrights related thereto. The presentation may contain confidential information pertaining to FRC and unauthorized use, disclosure, copying, dissemination, or redistribution is strictly prohibited. This is a Fort Washington Investment Advisors, Inc. presentation of the data and FRC is not responsible for the formatting or configuration of this material or any inaccuracy in the presentation thereof. This benchmark is compromised of the smallest 2,000 companies in the Russell 3000 Index. Portfolios in this composite include cash, cash equivalents, investment securities, and dividends. Cash is maintained, within each separately managed account segment, in accordance with our asset allocation ratio. The U.S. dollar is the base currency. The specific securities identified and described do not represent all of the securities purchased, sold, or recommended. Returns are presented gross and net of management fees and include the reinvestment of all income. Gross returns will be reduced by investment advisory fees and other expenses that may be incurred in the management of the account. Net of fee performance was calculated using the actual management fees charged. Individual portfolio returns are calculated on a daily valuation basis. Past performance is not indicative of future results. Performance from 4/1/2013 through 10/31/2017 was attained by an investment team employed by Sentinel Asset Management and lead by the current Senior Portfolio Manager. As a result of the Sentinel Small Company Fund acquisition by Fort Washington’s affiliate Touchstone Investments, Inc., the Senior Portfolio Manager and Small Company investment team are also responsible for the performance results shown from 11/1/2017 to current for Fort Washington. Fort Washington Investment Advisors, Inc. (Fort Washington), a wholly owned subsidiary of The Western and Southern Life Insurance Company, is a registered investment advisor and provides discretionary money management to a broad range of investors, including both institutional and individual investors. Assets under management include all portfolios managed by Fort Washington and exclude assets managed by and marketed as its Private Equity business unit. Fort Washington claims compliance with the Global Investment Performance Standards (GIPS®) and has prepared and presented this report in compliance with the GIPS Standards. Fort Washington has been independently verified for the periods 7/1/94 - 12/31/18. A copy of the verification reports are available upon request. Verification assesses whether (1) the firm has complied with all the composite construction requirements of the GIPS standards on a firm-wide basis and (2) the firm's policies and procedures are designed to calculate and present performance in compliance with the GIPS standards. Verification does not ensure the accuracy of any specific composite presentation. Policies for valuing portfolios, calculating performance, and preparing compliant presentations are available upon request. To receive a complete list and description of composites, contact Fort Washington by phone at (888) 244-8167, in writing at 303 Broadway, Suite 1200, Cincinnati, Ohio 45202, or online at fortwashington.com.