- The U.S. economy has made rapid progress recovering from business shutdowns owing to an unprecedented fiscal and monetary response. However, the COVID-19 pandemic is not under control as evinced by the shocking news about President Trump.
- Going forward, it is unclear whether new legislation will be passed to replace provisions in the CARES Act that have expired. But one thing is clear: The Federal Reserve will keep interest rates close to zero for the foreseeable future.
- The November elections could lead to significant policy changes if there is a “blue wave.” Biden’s fiscal plan calls for added government spending that would be financed by higher taxes on corporations and households earning more than $400,000.
- If so, the stock market could sell off if investors harvest capital gains before taxes are raised. However, any sell-off could be short-lived as investors assess the prospects for future growth.
U.S. Stock Market Powers Ahead
The U.S. stock market rally since late March has been among the most powerful in history and continued unabated until September, when it experienced a correction of about 10% (Figure 1). Even then, the S&P 500 Index at the end of September was up by 45% from the March lows while the tech-heavy Nasdaq Index rose even more at 60%.
Figure 1: 2020 Investment Returns by Asset Class (in percent)
| Stock Market | Q1 | Q2 | Q3 |
|---|---|---|---|
| U.S. (S&P 500) | -19.6 | 20.5 | 8.9 |
| Russell 20001 | -30.6 | 25.4 | 4.9 |
| International (EAFE $) | -22.7 | 15.1 | 4.9 |
| Emerging Markets (MSCI $) | -23.6 | 18.1 | 9.7 |
| U.S. Bond Market | Q1 | Q2 | Q3 |
|---|---|---|---|
| Treasuries | 8.2 | 0.5 | 0.2 |
| IG Credit | -3.1 | 8.2 | 1.5 |
| High Yield | -12.7 | 10.2 | 4.6 |
The stock market’s performance mirrors the path of the U.S. economy. When the coronavirus pandemic hit in March, it necessitated widespread shutdowns of businesses that many economists warned would result in a severe recession. This was confirmed in the second quarter when the economy experienced the steepest quarterly decline in post war history, with real GDP contracting by 33% at an annual rate.
An unprecedented policy response that included nearly $4 trillion in federal support and the Federal Reserve expanding its playbook from the 2008 financial crisis helped to contain the fallout. These actions and the reopening of businesses generated a strong rebound in the third quarter: Estimates of annualized real GDP growth are in the vicinity of 25%-35%.
According to Jim Glassman of JPMorgan Chase, roughly 85% of final demand has returned to pre-crisis levels, and the level of real GDP is back to 97-98% of the February level.2 Moreover, consumer spending is back to pre-crisis levels due to massive transfer payments from the federal government. Viewed from this perspective, what happened to the economy is analogous to a hurricane that created widespread destruction, but which also set the stage for a powerful revival.
The Economy Is Not Out of the Woods
In the meantime, the U.S. unemployment rate, which peaked at 14.7% in April, has fallen to 7.9% in September, as many furloughed workers have returned to their jobs. There has also been a significant reallocation of labor from dying businesses to up-and-coming ones.
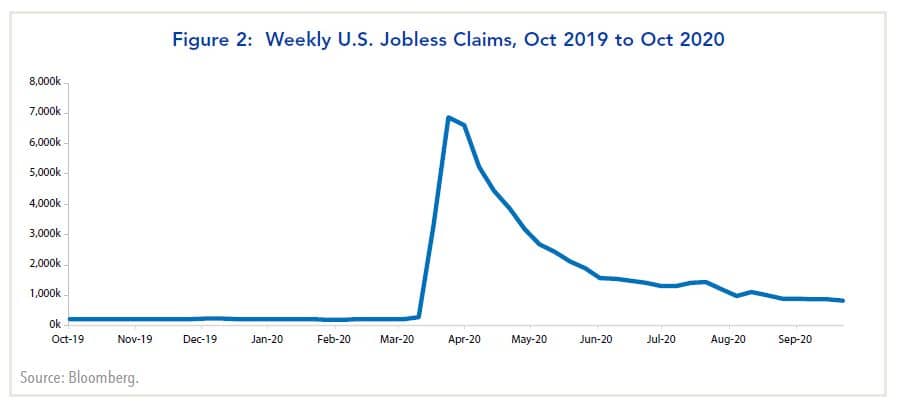
However, significant layoffs have continued as evinced by high weekly jobless claims (Figure 2). Furthermore, a wave of new layoffs from airlines and several major corporations have been announced recently. Meanwhile, the number of those permanently unemployed has increased to 3.8 million in September from 2 million in April.
Looking ahead, the big unknown is whether a second wave of COVID-19 will hit in fall and winter, which could slow the pace of recovery. There already has been a spike in cases since the Labor Day weekend. It has delayed school openings in some states, and the pace of recovery slowed in September. Amid all of this, the U.S. stock market experienced a correction of about 10% during the month.
Fed to the Rescue
The main factor limiting the market’s upside is favorable news already is priced into the market. First, valuations as measured by one year forward P/E multiples are high. Second, Wall Street analysts are calling for a significant recovery in S&P 500 profits in the coming year.
The principal factor supporting the market is interest rates are likely to remain close to zero for the foreseeable future. The Federal Reserve recently announced that it will now target an average rate of inflation of 2% over a business cycle. Consequently, if inflation undershoots the target in a year, it will be allowed to overshoot it in subsequent years. Moreover, the Fed will no longer raise interest rates preemptively if unemployment is low. Accordingly, the Fed has been proactive in lessening downside risks for the economy and the stock market.
Impact of the November Elections
Meanwhile, investors will turn their attention to the upcoming elections. While polls show Joe Biden maintaining a significant lead over President Trump nationally and a fair chance the Democrats could win the Senate, the election has not been a major driver of the stock market thus far. One reason is investors are mindful of the surprise results in 2016 and are inclined to await the actual results.
One of the biggest differences from the policies of the Trump administration is Biden’s fiscal plan. It is estimated by the Penn Wharton Budget Model (PWBM) to increase federal spending by $5.4 trillion over the next ten years.3 If enacted, it would increase federal spending to 24% of GDP by 2030 from 21% in 2019.
To help finance the increased federal spending, Biden would roll back the Tax Cut and Jobs Act (TCJA) enacted in December 2017. The corporate tax rate would be increased to 28% from 21% while the rate on foreign profits would be increased and a minimum tax on corporate book income would be imposed.
On the personal side, households with adjusted gross income (AGI) of $400,000 or less would not see their taxes increase directly. Those above this threshold (the top 1.5 percent of households) would face an average decrease in after-tax income of 17.7%.
In these circumstances, increased government spending is unlikely to generate substantially higher Treasury bond yields. However, the stock market could sell-off if Biden wins and individuals opt to sell stocks and pay capital gains taxes before higher taxes are imposed.
Over the long term, however, the main consideration for investors is whether Biden would be beholden to liberal Democrats such as Bernie Sanders and Elizabeth Warren. The fiscal plan Biden has put forth suggests otherwise, as the scope of federal spending and tax changes is less extreme. Furthermore, the assessment of the PWBM, Moody’s Analytics, and economists at Goldman Sachs is the Biden plan could boost growth in the future. If so, any stock market sell-off could be short lived.
1Frank Russell Company (FRC) is the source and owner of the Russell Index data contained or reflected in this material and all trademarks and copyrights related thereto. The presentation may contain confidential information pertaining to FRC and unauthorized use, disclosure, copying, dissemination or redistribution is strictly prohibited. This is a FWIA presentation of the Russell Index data. Frank Russell Company is not responsible for the formatting or configuration of this material or for any inaccuracy in FWIA’s presentation thereof.
2Weekly Insights on the Markets & the Economy, September 28, 2020.
3PWBM Analysis of the Biden Plan, September 14, 2020.