Treasury Yields
As shown in the chart below, the spread between 10-year and 2-year Treasury yields turned negative in mid-2022 and it is still negative today, some 20 months later. This is the longest period of an inversion since the 1980s without a recession.
Figure 1: Spread Between 10-year and 2-year Treasury Yields
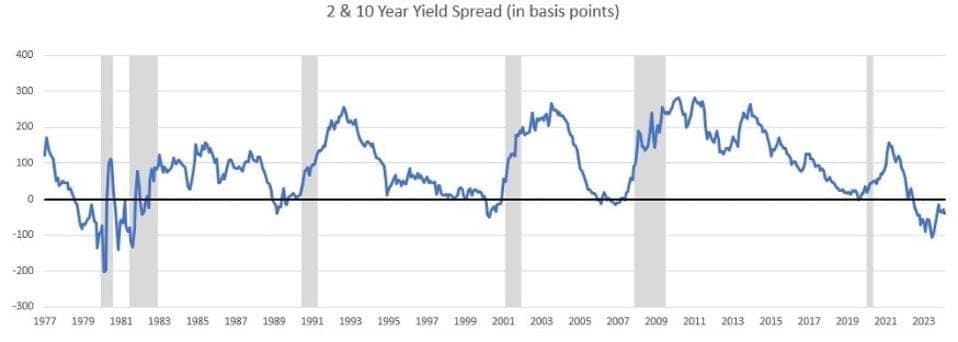
Source: Bloomberg. 2- and 10-Year Yield Spread.
While most economists were predicting a recession in 2023, the consensus is that a soft landing is more likely now, according to a Wall Street Journal survey of economists in early January. Those surveyed lowered the probability of recession in 2024 to 39% from 48% in the October survey. More recently, job growth has been stronger than expected, and bond investors have pared back their expectations of Fed policy easing this year from six interest rate cuts at the start of this year to three cuts now, which is in line with the Fed’s forecasts.
Why Is the Yield Curve a Less Reliable Indicator of Recession Now?
One possibility is there is still a link between the shape of the yield curve and a recession, but it is taking longer to play out. This is the view of Professor Campbell Harvey of Duke University, who popularized the notion about a yield curve inversion being an accurate predictor of recessions. His view is that a recession might have been avoided had the Fed stopped raising rates at the start of 2023. However, he thinks a recession is likely now because the Fed persevered in raising rates too long. That said, he concedes that if one ensues it is apt to be mild because the job market is strong.
Goldman’s economists, by comparison, downgraded the likelihood of recession to 20% in the second half of last year and more recently to 15%. According to a Bloomberg report, Goldman's Chief Economist Jan Hatzius contended in a recent note that the inversion is different this time, partly because the Fed has undertaken massive purchases of long-term bonds since the 2008 financial crisis with the goal of keeping their yields low. As a result, the term premium, or the added compensation investors expect for the uncertainty associated with holding longer-term debt, has been negative for the past 10 years rather than positive. In Hatzius’ view, economic forecasts also became overly pessimistic, which put added downward pressure on long-term yields.
Economy Has Been Buffeted by Two Simultaneous Shocks
My own interpretation of what is happening is less technical. I contend the main difference today from previous bouts of recession is that the economy has been buffeted by two simultaneous shocks.
- The initial shock was the onset of the COVID-19 pandemic. It caused output to plummet and unemployment to spike as businesses and schools were shuttered. This type of shock can be depicted graphically as an inward shift in the aggregate supply curve. It typically results in stagflation, or slower growth and higher prices.
- The second shock was the policy response to the pandemic. The Fed reduced interest rates to zero while quadrupling its balance sheet, while the federal government increased outlays by $5 trillion to bolster households and businesses, a New York Times interactive showed. These policy moves caused aggregate demand to shift outward, boosting both output and prices.
Amid this, investors had little to guide them in how the economy would react to the shifts in supply and demand. When inflation spiked in 2022 and the Fed tightened monetary policy aggressively, the yield curve inverted as investors assumed it would spawn a recession. However, they under-estimated the inherent resilience of the economy to higher rates, as well as the speed with which inflation would recede as supply-chain disruptions eased.
In This Case, Past Doesn't Paint a Picture of the Future
The recent experience is very different from prior recessions. They typically occurred when demand was strong and the economy overheated as it approached its productive potential. This environment created inflationary pressures that led to high inflation expectations and higher bond yields. In these circumstances, the Fed responded by raising interest rates to break the back of inflation expectations. When the economy eventually weakened, the Fed pivoted its policy from tightening to easing.
My takeaways from the recent experience are two-fold.
- First, investors should not look at changes in the shape of the yield curve in isolation. Rather, they need to consider the underlying factors that are causing the changes. As an August 2018 economic letter by the San Francisco Federal Reserve reminds us, “correlation is not causation.” What makes the current situation unusual is that both aggregate demand and supply shifted simultaneously in opposite directions.
- Second, even if the yield curve’s shape does not signal a recession this time, it is still an important indicator for investors to monitor. This is especially the case when inflation is mainly driven by strong aggregate demand.
A version of the article was posted to Forbes.com on March 3, 2024.