Table of Contents
Key Points
- Securitized products may offer an attractive long-term risk/return profile and potential sources of both income and return.
- Securitized products can provide investors diversification relative to other fixed-income sectors.
- While some investors may dismiss this segment of the fixed income market as "too risky," it is our objective to highlight the changes following the Great Financial Crisis (GFC), as well as the structural appeal and relative value of securitized products.
What are Securitized Products?
Securitized products are the second-largest segment of the entire U.S. Bond market, comprising $14 trillion (25% of the market) and surpassed in size only by U.S. Treasuries at $24 trillion. Corporate Bonds, while generally perceived to be more commonplace than securitized products, are surprisingly a smaller portion of the market, at $10 trillion (19% of the market). The remaining $7 trillion is split across smaller sectors including municipal bonds, government agency debt, and money markets. The securitized products market encompasses both Mortgage-Backed Securities (MBS) and Asset Backed Securities (ABS), which fall into two categories: agency (securities backed by key government agencies including Fannie Mae, Freddie Mac, and Ginnie Mae), and non-agency (securities without the support of a government entity). The focus of this paper is on the non-government guaranteed, or non-agency, segment of the securitized products market. This segment comprises just over 5% of the total U.S. bond market, or $3.1 trillion (Figure 1).
Figure 1. The U.S. Bond Market is Over $55 Trillion
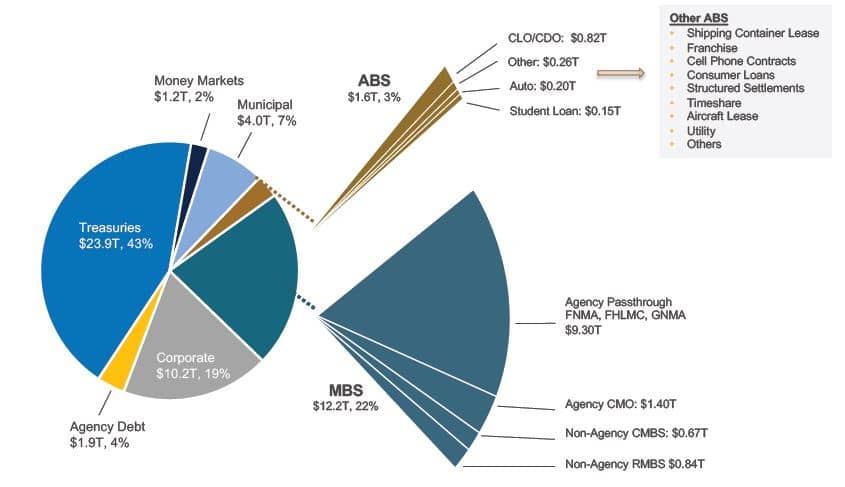
Source: SIFMA – Treasury, Corporates, Municipals, Agency Debt and Money Markets as of 12/31/2022. MBS and ABS as of 12/31/2021.
Securitization is the process by which financial assets are pooled and placed into a bankruptcy remote trust (the assets of which are protected from the depositor and/or sponsor of the trust), so they can be repackaged into both equity and interest-bearing securities, also known broadly as asset-backed securities. The cash flows from the underlying assets are passed through to owners of the trust’s securities based on rules outlined in the governing document of the trust. These rules create distinct classes, or tranches, which have differing priority of principal repayment and differing application of losses. This results in securities with a range of maturity and risk profiles and, ultimately, return profiles. This tailoring of risk increases the appeal of the trust’s securities to a wider range of investors with varying risk and return objectives (Figure 2).
Figure 2. Securitization Structure
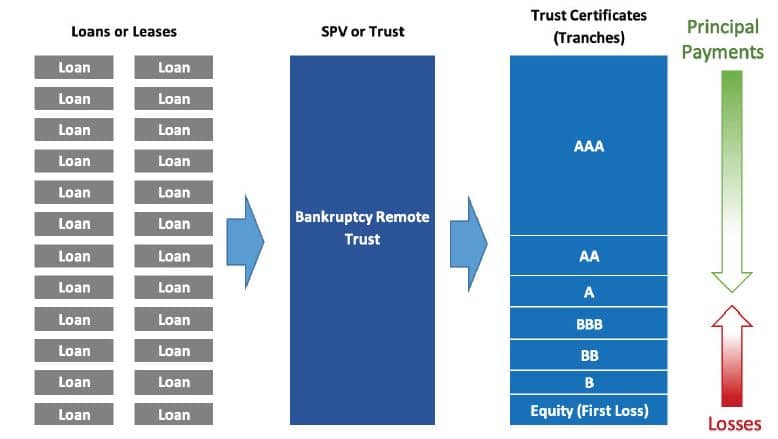
Source: Fort Washington. Tranches with higher credit ratings are senior in the capital structure of the Trust and, therefore, have first priority on the Trust’s assets.
Assets typically securitized include residential mortgage loans, auto loans, credit card receivables, and commercial real estate loans. Less common assets include equipment leases, tax liens, shipping container leases, solar panel loans, cash flows from restaurant franchises, and many others (Figure 3). Most people are surprised to learn how many of their personal financial obligations are funded through the securitization process.
Figure 3. Securitization and the Consumer

Source: Fort Washington.
Evolution of Securitization
Modern securitization in the United States dates to 1970 when the Government National Mortgage Association (Ginnie Mae) sold securities backed by a portfolio of mortgage loans. The idea was to make investing in residential mortgages more attractive to banks and institutional investors. This would increase available capital and lower the cost of home ownership. In the 1980s, tranching became a significant advancement with the introduction of collateralized mortgage obligations (CMOs), as well as several new asset types including auto loans, credit card receivables and the first commercial mortgaged-backed security (CMBS) in 1984.
The securitization market evolved rapidly with more collateral types and innovative structures, particularly in the non-agency, or privately sponsored, mortgage markets. The first sub-prime residential mortgages were securitized in the early 1990s. Exponential growth in the non-agency mortgage market through the 1990s and early 2000s changed the dynamic between lenders and borrowers. Traditionally a bank lent money for a mortgage to its customer, held the mortgage loan on its balance sheet and maintained a relationship with the customer. As securitization exploded, many bank (and non-bank) originators shifted to an “originate-to-securitize” model and retained no exposure to the loans—the alignment of interest between originator and investor, and the relationship with the borrower, broke down. This resulted in weak collateral underwriting, deteriorating securitization structures and, ultimately, the mortgage crisis which devolved into the GFC in 2007-2008.
Securitization Post-GFC
The securitization markets improved markedly after the GFC with stronger collateral underwriting and enhanced securitization structures. The Dodd-Frank Wall Street Reform and Consumer Protection Act strengthened the securitization markets by reducing risks and increasing oversight of banks, lenders and underwriters. Significant improvements include risk retention requirements to ensure alignment of interest between originators, sponsors, and investors; the creation of “qualified mortgages” with more stringent underwriting guidelines including an assessment of a borrower’s ability to repay; and the creation of the Consumer Financial Protection Bureau (CFPB) which ensured reasonable lending terms for consumers. In addition to the increased regulatory oversight, investors and rating agencies demanded securitization structures with more credit enhancement, more effective performance triggers, and better collateral quality. Even collateralized loan obligations (CLOs), one of the securitization models that was validated during the GFC and performed well, saw significant structural improvements when the market reopened in 2011 (Figure 4).
Figure 4. Collateralized Loan Obligations
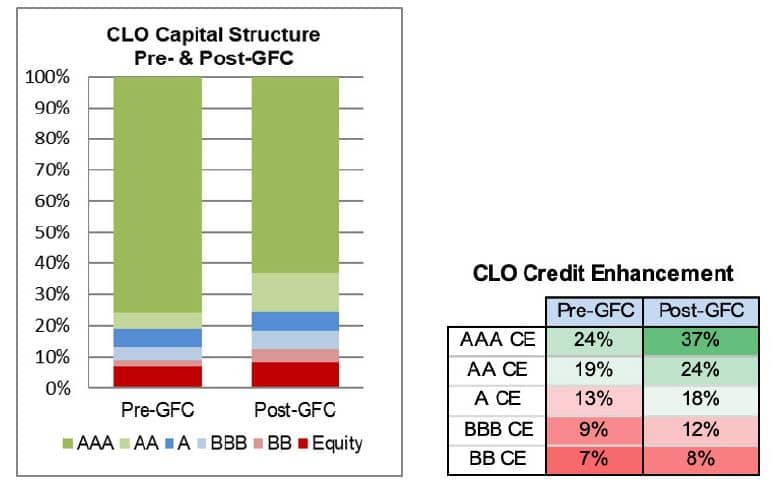
Source: Fort Washington.
The securitization markets today are vastly different compared to the pre-GFC period. There was a massive migration of knowledge from investment banking to investment management when securitization came to a standstill and banking teams were slashed. A number of former bankers and analysts founded investment firms to capitalize on the market dislocation, while others established data analytics companies to support securitized investing. Because of this talent migration and the proliferation in capabilities (better tools and data), the investing side of the business made a giant leap forward; thus, expanding the breadth and depth of securitized markets.
The Rating Agencies
The rating agencies, much maligned for their role in the “race to the bottom,” have seen significant reform. Prior to the GFC, competitive pressures incentivized rating agencies to issue overly optimistic ratings in an effort to increase market share. Institutional investors seeking higher ratings for better capital treatment provided further incentives for rating inflation. These factors combined to promote weaker collateral underwriting and weaker structural protections for investors.
Dodd-Frank implemented reforms in four key areas: it reduced the reliance of regulators on ratings to set capital requirements (banking and insurance); it increased the legal liability of credit rating agencies; it gave the SEC more power to regulate the rating agencies; and it sought to reform the issuer-pay model (outcome to be determined). While the ratings offered by the agencies should only be treated as a single input into a robust risk analysis and investment decision-making framework (and not relied upon exclusively), it is clear that their criteria have improved. The resulting changes produced superior securitization structures, which the rating agencies have maintained, or further improved.
Shadow Banking
Today, non-agency securitizations are playing an increasingly important role in the broader financial markets. As banking regulation accelerates (Basel III, Dodd-Frank and the potential fallout from the Silicon Valley Bank and Signature Bank failures in 2023), bank lending is becoming more selective. Therefore, alternative sources of capital are necessary to maintain a healthy economy. The securitization markets and the private capital markets have developed into a shadow banking industry, effectively replacing much of the lending function traditionally performed by banks. High-yield leveraged loans (i.e. bank loans), which historically were the purview of regional and commercial banks and held on their balance sheets, are now the primary financial asset in a CLO. Institutional investor demand for CLOs has made them one of the largest ABS sectors. Traditionally bank-financed assets such as consumer loans, equipment leases, multi-family property loans, and solar panel loans are now increasingly financed in the securitization and private markets.
Structural Appeal
Structurally, an ABS is attractive because it is secured debt backed most commonly by a fixed pool of assets. A well-known trustee serves as a gatekeeper, distributing cash flows to the various parties to the trust and issuing a monthly “health” report on both the underlying assets and the structural features of the trust. The rules governing these trusts tend to be strict with dynamic triggers (structural changes that occur if the trust and its assets are performing poorly) which can further enhance protections for the debt holders. For investors willing and able to process this monthly health report, there becomes a degree of predictability to future cash flows. Deterioration in cash flow is typically related to macro-economic fundamentals, but occasionally it is due to weak collateral underwriting or poor performance by the servicer of the asset pool.
This contrasts with corporate bonds, which also have macro-related performance characteristics, but tend to have more idiosyncratic risk, which can come in many forms, such as political risk, policy risk, industry disruption, natural disaster, and fraud. The following are a few examples of risks: political or policy risk, such as China’s recent ban on state officials using Apple iPhones; and political or fraud risk, such as the Brazilian political corruption scandal in 2014, where politically appointed directors at Petrobras received illegal kickbacks. There are numerous examples of technological innovation disrupting industries including cellphone cameras upending the camera business or Amazon disrupting traditional brick-and-mortar retailers.
Fundamental risk in the corporate bond market has also increased as gross and net leverage has risen since the post-GFC lows (Figure 5). Countering this increased leverage is higher debt service coverage ratios (DSCR) which resulted from a long period of ultra-low interest rates. However, rates have risen notably over the past two years and DSCRs are likely to begin decreasing. Additionally, covenants, the legal term in a corporate bond transaction that protects the lender (or investor), have been steadily eroding over the past 10 years (Figure 6).
Figure 5. Median Leverage: Non-financial, Non-utility U.S. Issuers
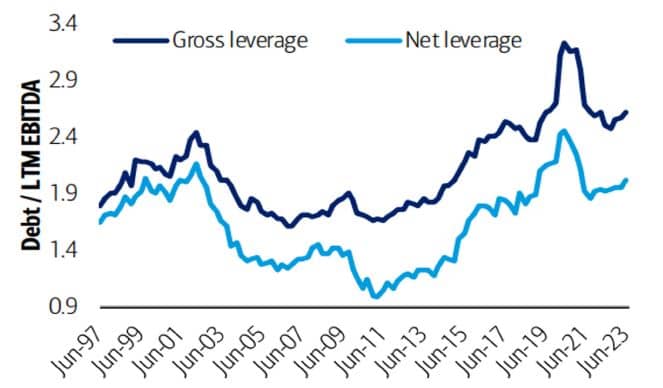
Source: BofA Credit Market Strategist 08/18/2023.
Figure 6. Moody's Covenant Quality Indicator (CQI)
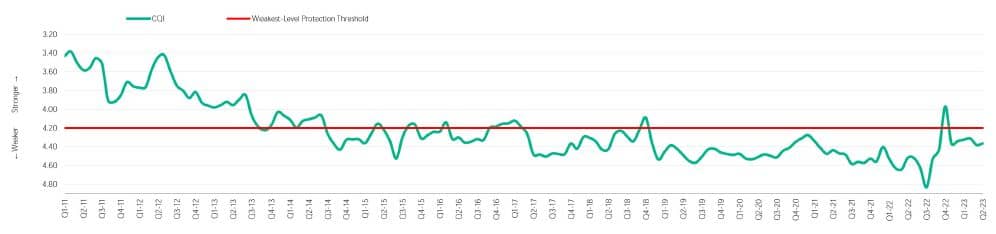
Note: CQI reflects all high-yield bonds, including high-yield lite. High-yield-lite bonds lack a debt incurrence and/or a restricted payments covenant and automatically receive the weakest possible CQ score of 5.0. Source: Moody’s Investors Service.
Relative Value
In addition to the structural appeal, ABS tend to offer attractive value when compared to similarly rated corporate bonds. Figure 7 below shows the option adjusted spread of the ICE BofA ABS index (AA-BBB) over the ICE BofA Corporate index—both indices have an average quality rating of A-. The ABS index has outspread the Corporate index by an average of 79 basis points since early 2016 when compositional changes to the ABS index made the average credit quality and duration comparable to the corporate index. Spread changes in the securitized sectors tend to lag the spread changes in the corporate sector—slower to widen in times of stress and slower to recover. Spreads have remained wide since the COVID-related market dislocation in March 2020 and represent a potential opportunity. Returns over the same time period show that ABS has delivered higher returns with about two thirds the volatility of corporate bonds. (Figure 8).
Figure 7. Excess Spread of ABS Index Over Corporate Bond Index
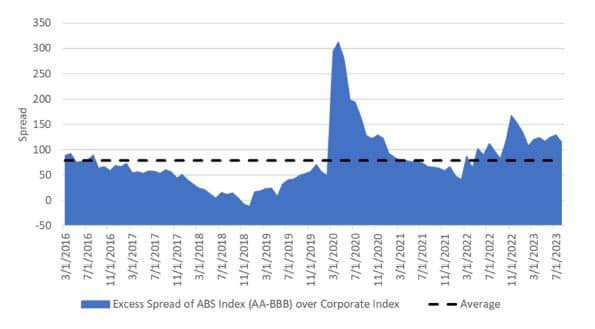
Source: Fort Washington.
Figure 8. Since March 2016, Return vs. Standard Deviation
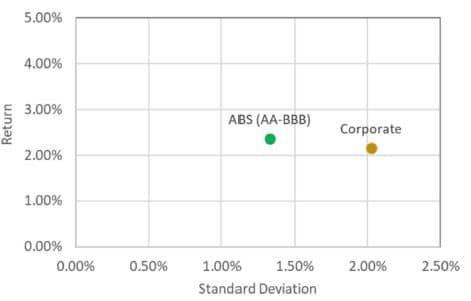
Source: Fort Washington.
Liquidity/Complexity Premium
The spread pickup in securitized products tends to be positive and material in most market conditions. Securitized investors are effectively trading idiosyncratic risk in corporate bonds for incremental illiquidity risk and a complexity premium in the securitized sectors. This liquidity premium is driven by several factors including the size of the market, pricing transparency, and the number of investors and dealers willing to transact in a security at any given time.
Many of the securitized sub-sectors are much smaller markets with fewer investors (measured in the hundreds, versus thousands for some corporate bonds). Quite a few of these sectors are in the $3 billion to $50 billion size range, too small for the larger asset aggregators to invest effectively, but large enough for a “right-sized” manager to build meaningful positions. While many of these sub-sectors have matured and are increasingly appropriate for a wider investor base, they can be less efficient and subject to technical pressures (supply and demand). Corporate bonds, while enjoying a larger investor base, have seen dealer participation and inventories pared back considerably in the post-GFC period due to the Dodd-Frank Act and the Basel III framework. As a result, liquidity risk in the corporate market is much higher today (Figure 9). In normally functioning markets, the liquidity in both corporate and securitized bonds is similar. However, when markets become dislocated, corporate bonds tend to have more sponsorship, exhibit less volatility and recover more quickly.
Figure 9. Dealer Inventories as % of Market Volume
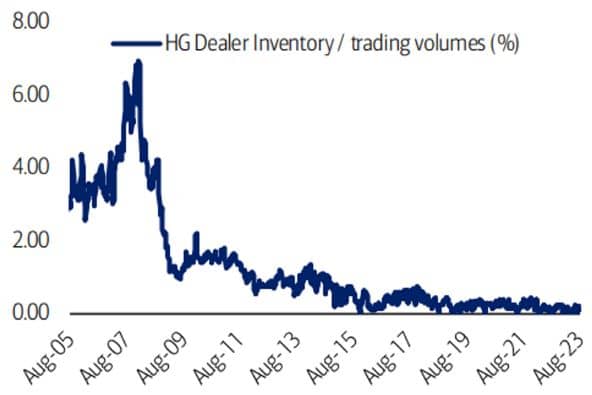
Note: Definition of dealer inventories has changed over time; therefore, BofA Global Research made certain assumptions. Source: Federal Reserve, Finra, BofA Global Research.
The complexity of the securitized markets is somewhat related to liquidity as it does work to reduce the buyer base. Securitized bonds require a high degree of specialization—both foundational knowledge and the ability to source, process, and manage a high volume of complex data. This requires internal and external resources including third-party data providers, cash flow modeling, proprietary tools, and databases (e.g., Figure 10). Understanding the investor base, the complex securitization structures, how collateral risk is underwritten, and how and where securities are placed into the market are all critical to understanding potential fundamental and technical performance of a securitized bond. As more investors have acquired these skills since the GFC, the securitized markets have matured notably.
Figure 10. Fort Washington Proprietary Database
Source: Fort Washington.
How Securitized Products Fit in a Fixed Income Portfolio
Mortgage-backed securities, asset-backed securities, and commercial mortgage-backed securities comprise a wide swath of the fixed income market and are appropriate for use in most fixed-income portfolios, including both total return and asset-liability management mandates. For total return strategies, securitized products can satisfy a range of risk appetites–from high quality, short duration to higher risk, high-yield applications.
Short Duration: Historically, securitized products have proven to be an efficient and liquid asset class in the front-end of the curve offering attractive returns for the risk. Within the Morningstar Short Term and Ultra Short Bond categories, multi-sector securitized-focused funds have tended to be top quartile performers and can help outyield money market funds by 100 basis points or more.
Intermediate Duration/Core Bond: Multi-sector securitized strategies fit nicely in a core bond, or core plus, framework. Treasuries make up the largest segment of the Bloomberg Aggregate Index at 42%, while Securitized (mainly agency mortgage-backed securities) comes in second with 28%, and Corporate bonds are the third largest with 25%. Top performing multi-sector securitized strategies can add 100-125 basis points of alpha to this Securitized sleeve (contributing ~30-35 basis points to the overall core portfolio) with similar price volatility and a modest increase in credit risk vs. the Securitized Index—a strong value proposition.
High Income: Corporate high yield investors may consider a more opportunistic securitized strategy, which invests in a combination of both investment grade and high yield securitized products. When evaluated through a credit and/or rate cycle, these strategies can produce similar returns relative to a high yield corporate index, but with a fraction of the volatility and with substantially lower credit risk.
Asset Liability Management: Lastly, short- to intermediate-duration asset/liability management frameworks can benefit from a multi-sector securitized strategy. The high spread, highly rated securitized assets tend to be more capital efficient for a regulated insurance company or bank, while offering compelling returns vs. comparably rated corporate bonds.
Conclusion
The securitized markets have made remarkable progress since the GFC. Every year, the investor base increases, particularly in the non-agency, or non-government guaranteed, segments of the markets. We have observed significant gains in the breadth and depth of these markets, with more investors, dealers, and investment banks, resulting in improved liquidity.
Importantly, institutional investors have broadly adopted securitized products and consultants and retail investors are increasingly interested. The insurance industry, spurred by private equity sponsors such as Apollo, Blackstone, Carlyle and KKR, has recognized the value in the asset class and has moved increasingly into the non-agency securitized markets since 2017—industry exposure has increased from 9% to 13% of invested assets.1
Although these markets can be less transparent (limited TRACE reporting in the securitized markets) and more technical in nature, these factors actually help to generate compelling relative value opportunities. Investors with the right tools and resources to navigate the liquidity and complexity risks can expect to find promising return opportunities for the foreseeable future.
Fort Washington
Fort Washington has been investing actively in the securitized markets for more than 20 years and manages $20 billion in securitized assets. Investors interested in adding a securitized product to the fixed income portion of their portfolio should consider the risks before buying. Fort Washington believes that active management is the key factor to successfully navigating this complex and inefficient marketplace.
1Asset growth estimate based on a proprietary insurance peer group study by Fort Washington Investment Advisors.