Index-Equivalent Spread Duration (IESD)
Index-Equivalent Spread Duration (IxDur) adjusts for two effects not addressed by spread duration, the conventional measure of spread risk: the tendency of riskier bonds to experience larger spread moves and the tendency of short maturity bonds to demonstrate more spread volatility than long maturity bonds.
The Tendency of Risker Bonds to Experience Larger Spread Moves
The tendency of risker bonds to experience larger spread moves was first demonstrated by Arik Ben Dor et al. at Lehman Brothers through their publication of DTS (Duration Times Spread)1 in the Journal of Portfolio Management during the Winter of 2007.
Ben Dor et al. found that changes in spreads are not parallel but rather linearly proportional to the level of spread, whereby bonds trading at wider spreads experience larger spread changes.
Systematic Spread Volatility vs. Spread Level (Investment Grade + High Yield Bonds)
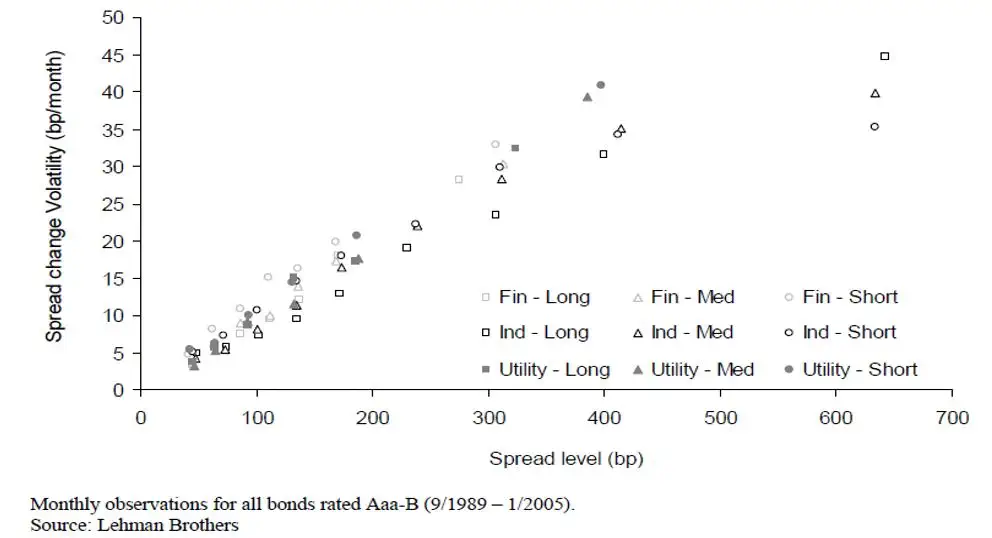 Fin: Financials; Ind: Industrials
A portfolio that matches the spread duration of a benchmark can still take more credit risk by investing in securities with wider spreads than that of the benchmark. Intuitively, bonds that trade at a wider spread than their peers are riskier and tend to react more strongly to systematic market shocks.
Ben Dor et al. supports the intuition behind their measure of spread risk, DTS, by considering the excess return attributable to change in spread (R). Where D represents the spread duration of a bond and s its spread; the traditional spread duration approach of an absolute change is given by:
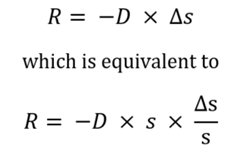
Here, the conventional measure of spread duration is the sensitivity to an absolute change in spreads, and DTS is the sensitivity to a relative change in spread. This notion of relative spread change provides for a formal expression of the idea that credits with wider spreads are riskier since they tend to experience greater changes in spread.
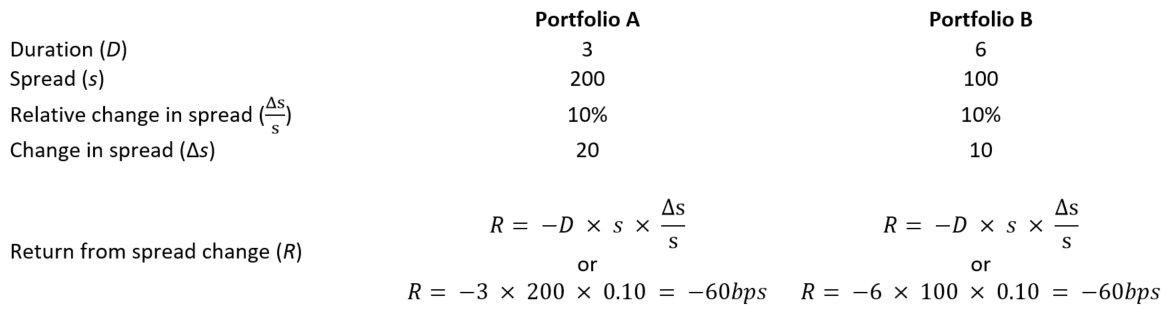
Portfolio Example
Consider the two portfolios, portfolio A with a spread of 200bp and spread duration of 3 years, and portfolio B with a spread of 100bp and spread duration of 6 years. The conventional measure, spread duration, implies that portfolio B is riskier than A since it has 3 more years of spread duration. However, since spread changes are not parallel but rather linearly proportional, both portfolios are equally as risky. If spreads widen 10%, expected spread returns are the same for both portfolios, inferring equivalent risk as shown below.
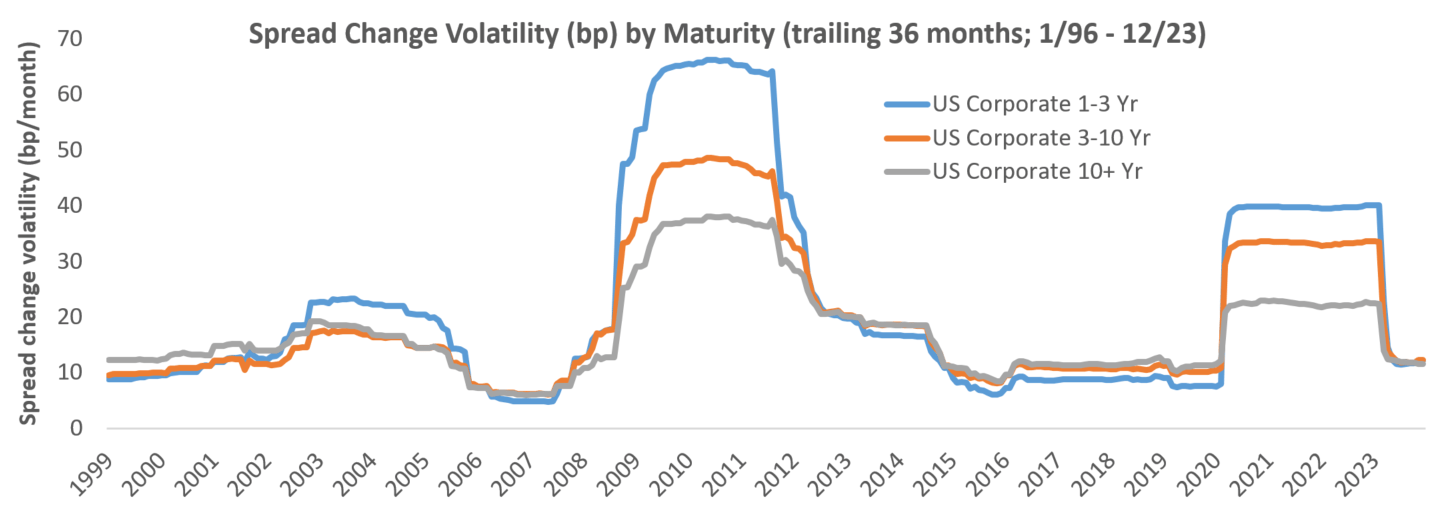
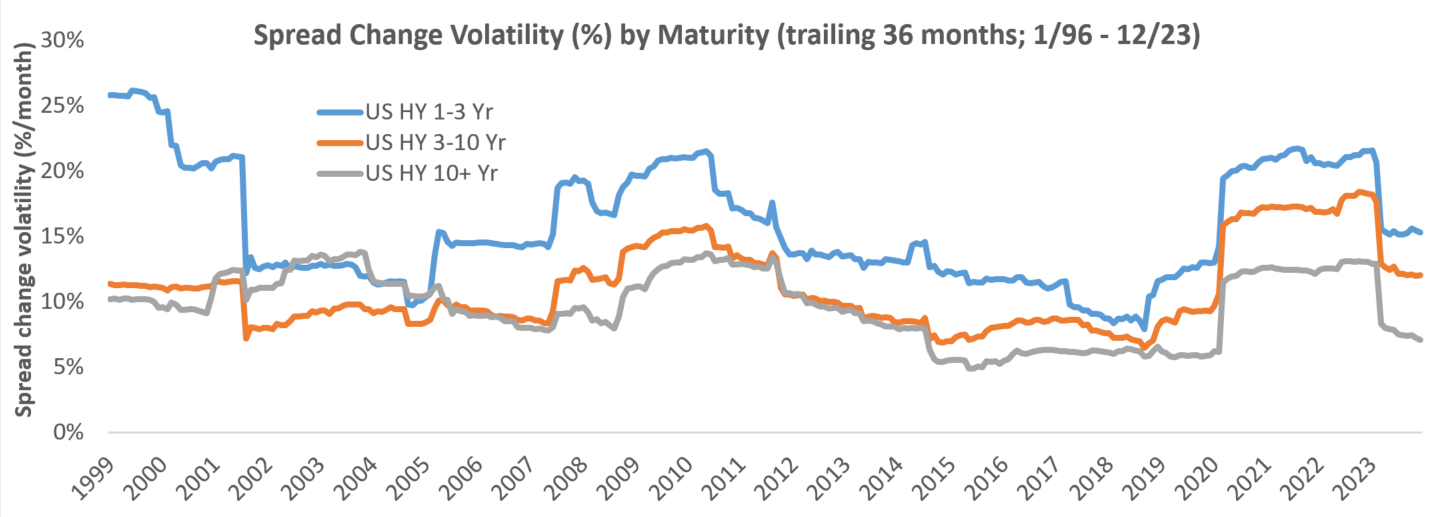
Spread Volatility: Short Maturity Bonds vs. Long Maturity Bonds
The tendency of short maturity bonds to demonstrate more spread volatility than long maturity bonds is not addressed by either spread duration or duration times spread (DTS). Spread duration assumes all maturities experience the same absolute change in spread while DTS accounts for the same proportional change in spread across all maturities.
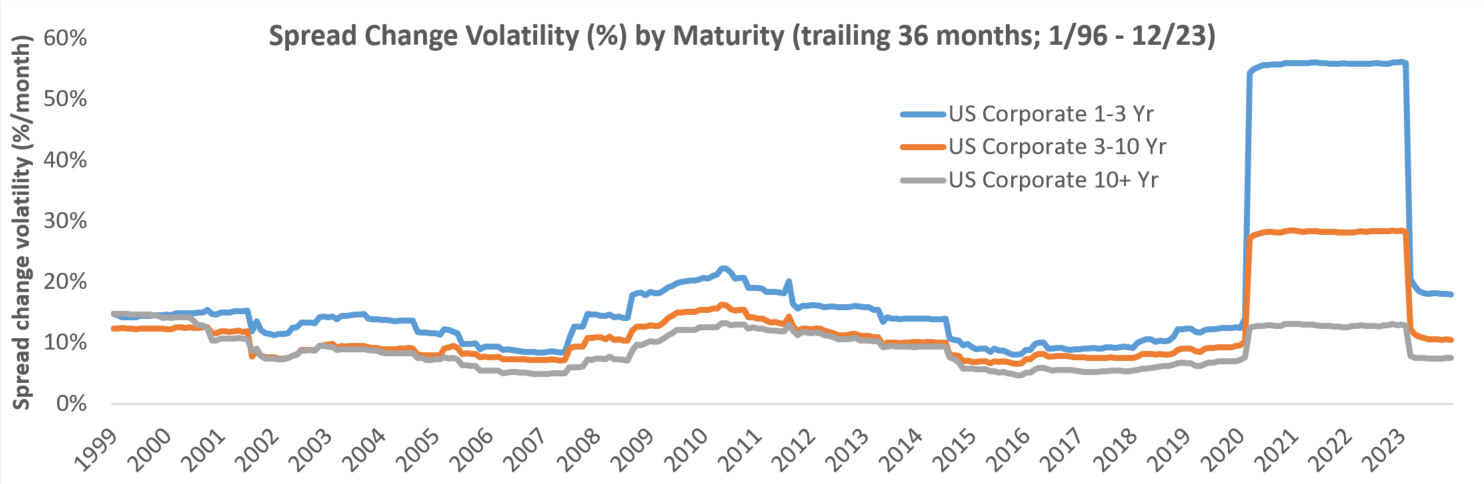
Using a large sample of monthly observations over the period 1/1996 – 12/2023, we can demonstrate that spread volatility is neither parallel nor proportional across maturities over time. Additionally, we can conclude that shorter maturity bonds exhibit more spread volatility than other maturities for both Investment Grade and High Yield.
There was a dramatic rise in absolute spread volatility for short maturity bonds relative to long maturity bonds during the Great Recession (‘08-‘09) and Covid Pandemic (’20). For this reason, we look at volatilities for the entire period and the period excluding the Great Recession and Covid Pandemic – both studies show higher volatility for short maturity bonds. Supportive of the study, during times of distress, bonds tend to trade on dollar price and short maturity bonds inherently require a larger change in spread to compensate for the shorter duration. The table below outlines the results.
Summary Statistics for Volatility by Maturity
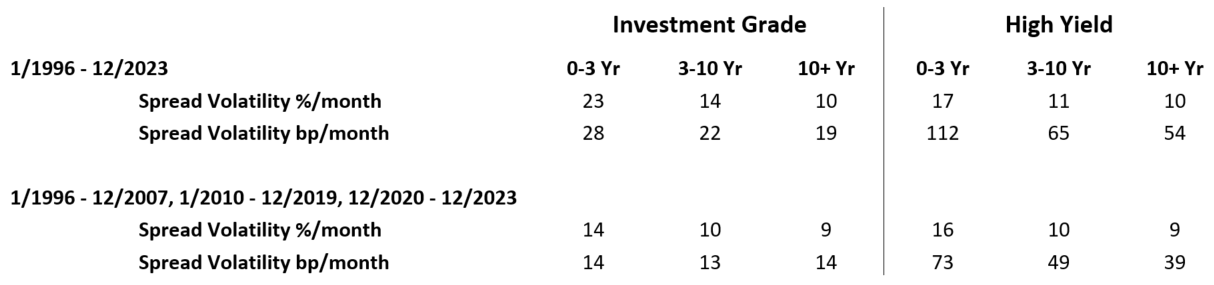
Source: Bloomberg PORT and Fort Washington.
Methodology: Index-Equivalent Spread Duration
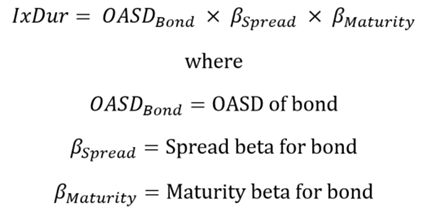
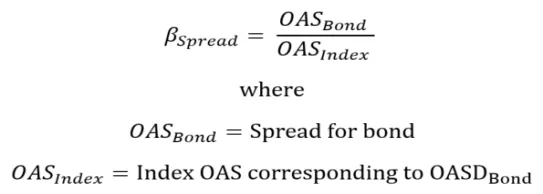
BSpread
BMaturity
We estimate a bond’s maturity beta using historical spread curve volatility relationships and current implied volatilities for the index. For example, consider a 2-year maturity index with a spread of 100 and volatility of 45%, and a 10-year maturity with a spread of 175 and volatility of 35%. A one standard deviation spread move for the 2-year and 10-year maturity points is 45bps and 61bps, respectively. If we normalize this, a 100bps change in the 10-year maturity would result in a 73bps change in the 2-year part of the curve. The beta for a 2-year bond would then be 0.73.
Example
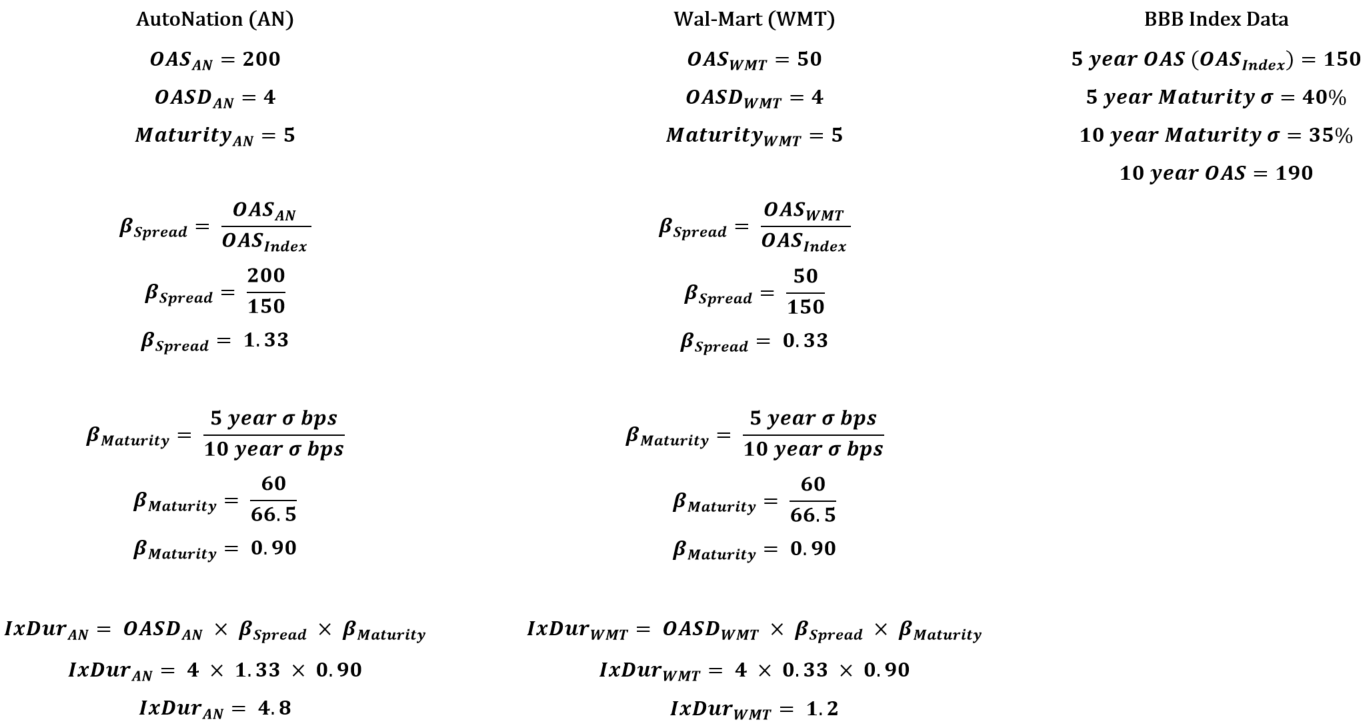
 *Price return for 100 bps change in 10 Yr BBB.
 Source: Bloomberg PORT and Fort Washington.
The implementation of Index-Equivalent Spread Duration is just one component of a well-rounded fixed income risk management platform that has been built at Fort Washington. We firmly believe that managing risk, coupled with an experienced investment team, offers a reliable path to investment success.