Risk Budgeting Over a Market Cycle
A well-defined risk management framework is the foundation for investment success. At the core of Fort Washington’s risk management framework is the use of a risk budget. The risk budget is a tool used to determine the range of potential risk within a portfolio and how much of that risk to utilize at any given time. This allows Fort Washington to explicitly manage the level of risk within the portfolio over a market cycle in order to maximize returns with a keen focus on capital preservation. A differentiator of Fort Washington’s Fixed Income process is that we measure credit risk through a single comprehensive metric, Index-Equivalent Spread Duration (IESD).
Establishing a Risk Budget
The initial objective for any risk budget is to establish the range of allowable risk, i.e., the minimum and maximum amount of risk acceptable within a portfolio. Starting with the lower bound, Fort Washington incorporates the strategy’s benchmark to set the minimum risk (0% risk budget). The benchmark establishes a neutral positioning as well as a target to outperform over time.
On the other end of the range is the maximum amount of risk, which is established for each portfolio by analyzing and quantifying each client’s risk tolerance. Fort Washington evaluates guideline limits within each Investment Policy Statement (IPS) to determine the upper range of risk tolerance.
Portfolio Construction
Once the risk range is established, Fort Washington measures and manages credit risk throughout the market cycle according to asset prices and our economic outlook. Consider a Core Plus portfolio that can have up to 30% high yield. The left end of the range, 0%, is a neutral level of risk relative to the Bloomberg US Aggregate Bond Index, with the rightmost bound representing 100% of allowable risk. Portfolios typically don’t move out to the upper or lower limits, as that would imply extreme conviction, which means our target risk level is usually around 25-75%. When valuations are high, or the macroeconomic landscape indicates slow growth, we would likely reduce risk by moving closer to 0%. Conversely, we would move right, or closer to 100%, as valuations cheapen and we anticipate strong economic growth.
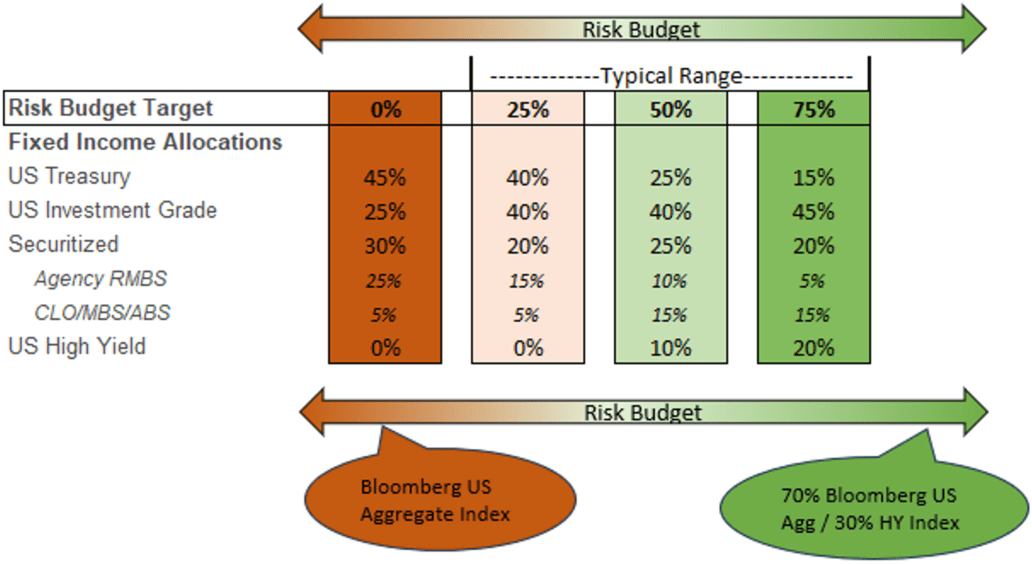
Source: Fort Washington.
While this illustration provides an example of what sector allocations might look like at different risk budget levels, it’s important to keep in mind that implementation varies due to relative value between sectors.
Conclusion
Overall, the risk budgeting process allows portfolio managers to measure and adjust credit risk over time. Our framework sets the minimum amount of risk at a level consistent with the portfolio’s benchmark and the maximum at a level based on each client’s risk tolerance and guidelines. At Fort Washington, our risk budgeting process is made more efficient and consistent through our measure of credit risk, IESD. This enhancement has translated to attractive risk adjusted returns. We anticipate sector allocation, driven by our proprietary risk budgeting process, throughout a market cycle to account for approximately half of total outperformance and have experienced excess returns across our multi-sector platform that aligns with that expectation.