"Buffett Indicator" Ratio
The logic is that the over long periods the valuation of the stock market should mirror the performance of the economy. However, there can be significant deviations in the interim owing to cyclical forces.
Since then, the ratio has been on a steady upward trajectory for more than a decade. In July of this year, the ratio surpassed the 200% threshold—representing more than a two standard deviation above its long-term trend.
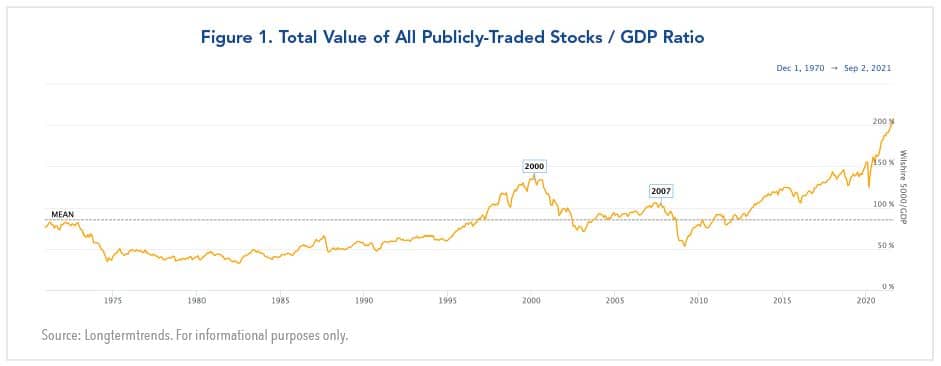
Is the Stock Market Over-Valued?
For many commentators, this is clear evidence that the U.S. stock market is considerably over-valued and ripe for a sell-off.
For example, a commentary by Dhruv Goyal published by the CFA Institute earlier this year observed that “the current mismatch between equity market cap and GDP is the highest and longest lasting of the last 50 years.” The article observes that every time the market cap has deviated so sharply from GDP, it has snapped back just as rapidly. Goval concludes that while it is impossible to time markets, “the Buffett indicator is flashing red and has been for a while now, so caution is the watchword.”
Most economists would agree with this assessment considering that the ratio has been mean reverting throughout its history. However, James Glassman of J.P. Morgan Chase looks at what is happening differently.
In his latest commentary, Glassman observes that the doubling of the U.S. stock market relative to GDP is linked to changes in the trend of two key variables. One is the decline in the equilibrium level of real interest rates since the 2008 GFC that has reduced the equity risk premium. The other is a secular rise in the share of corporate profits relative to GDP over the past two decades. In the wake of these developments, Glassman concludes that they have contributed to a secular increase in the ratio of market capitalization to GDP.
Glassman’s rebuttal to the consensus view, in short, is that while the ratio of market cap to GDP is mean reverting, the mean has shifted upward owing to key structural change in the economy.
My own take is that Glassman’s analysis helps to explain the increase in the Buffett indicator since the GFC, but it is not clear that there has been a permanent shift.
First, Glassman acknowledges that the forces contributing to the secular decline in the equilibrium level of the real risk-free long-term interest rates are uncertain. He cites several possible explanations including demographic factors that have slowed potential growth in developed economies, successful management of inflation by central banks, and rapid globalization that has boosted saving rates.
U.S. Economy is at an Inflection Point
Meanwhile, the U.S. economy is at an inflection point where inflation has accelerated well above its trend of the past two decades. Investors are divided over whether the spike is temporary as the Fed asserts, or ongoing as a result of massive fiscal and monetary stimulus. If the latter view proves correct, the equilibrium level of interest rates could shift materially higher, increasing the equity risk premium.
Second, even more mystifying is the secular rise in profit margins in the past two decades: After tax profits have climbed to a post-WWII high above 10% of GDP recently, after having averaged about 6% in the twentieth century.
The standard explanation is that the increase in profit margins is tied to the revolution in technology (and the emergence of tech giants) and to a shrinking share of wages resulting from globalization. An NBER working paper on the topic finds some credence to this argument, but researches at the Center for Economic and Policy Research have challenged this view.
While the debate over the relative shares of profits and labor income is unresolved, there is no doubt that U.S. corporate profits have staged a powerful recovery from the COVID-19 pandemic. In the second quarter of this year, U.S. corporate profits were up 69% from a year ago. Moreover, firms have more pricing power today than in the past to maintain high profit margins that is supported by massive monetary and fiscal accommodation.
Weighing these considerations, I do not foresee an imminent end to the bull market in equities, although a correction could occur any time. Beyond the near term, the likelihood is that valuations will compress when the Federal Reserve tightens monetary policy. However, as long as profit margins stay elevated, investors should not expect the “Buffett indicator” to revert back to its prior mean.
A version of this article was posted to Forbes.com on September 2, 2021.