- Forecasts of a powerful U.S. recovery this year appear on target. However, inflation has exceeded expectations. Despite this, bond yields declined in the second quarter, while the stock market ended the quarter at record highs.
- The key call for investors is whether the pickup in inflation will be temporary or sustained. The Federal Reserve believes it will be transitory, but officials tempered their stance at the June FOMC meeting.
- Our take is it is too early to be confident of the outcome because it will hinge on the how the Fed responds and on how much of the Biden fiscal agenda is enacted. Prospects for a scaled-down, bipartisan infrastructure bill have improved, but the rest of President Biden’s agenda will require full Democratic support.
- The most likely outcome is the stock market will continue to grind higher until there are clearer indications about inflation. Meanwhile, we are overweighting risk assets in investment portfolios.
Second Quarter Update
During the first quarter of this year, forecasts for U.S. economic growth for 2021 were upgraded to 6%-7% from 4% previously. This mainly reflected passage of two COVID-19 relief packages totaling nearly $3 trillion and rapid progress in disseminating vaccines to the public that enabled many businesses to re-open.
The upward revisions to growth are warranted: Estimates for the second quarter are about 10% at an annual rate. If so, actual growth during the quarter would be 2.5%, which would exceed the average annual rate over the previous decade. Looking ahead, the pace of economic growth is expected to taper to about a 5% annual rate in the second half of this year and to 3.0%-3.5% next year.
The jobs picture has also continued to improve with the unemployment rate for June dropping to 5.9%. However, there are still more than eight million people out of work since the pandemic struck over a year ago. Some have dropped out of the workforce either for personal reasons or because the increase in unemployment benefits reduced incentives to accept lower paying jobs.
Meanwhile, the focus of investors has shifted to the outlook for inflation. Most were prepared for a temporary surge in the second quarter as a result of base effects from a year ago. However, the rise of inflation in May exceeded expectations, with headline and core CPI rates reaching 5.0% and 3.8%, respectively, over the prior 12 months.
Thus far, views of market participants are in line with the Fed’s thinking that higher inflation will be transitory. The Treasury yield curve flattened during the quarter, with the 10-year yield ending the second quarter about 25 basis points below the 2021 peak of 1.7%. Still, returns for Treasuries and investment grade corporates were negative for the first half of this year, while the stock market ended the quarter at record levels boosting returns for this year to double digits. (Figure 1).
| STOCK MARKET | MARCH 31, 2020 - June 30, 2021 | 2021 First Half |
|---|---|---|
| U.S. (S&P 500) | 69.7 | 15.2 |
| Russell 2000 | 103.2 | 17.5 |
| NASDAQ | 90.3 | 12.9 |
| International (EAFE $) | 53.2 | 9.2 |
| Emerging Markets (MSCI $) | 67.0 | 7.4 |
| U.S. BOND MARKET | March 31, 2020 - June 30, 2021 | 2021 First Half |
|---|---|---|
| Treasuries | -2.8 | -2.6 |
| IG Credit | 11.5 | -1.3 |
| High Yield | 27.1 | 3.6 |
Source: Bloomberg. Past performance is not indicative of future results. You cannot invest directly in an index. For informational purposes only.
Framing the Debate over Inflation
Looking ahead, inflation is likely to be the key factor influencing investment returns. Should the acceleration prove temporary, bond yields may increase somewhat due to stronger economic activity (and credit demand), but not by enough to derail the stock market rally. However, if inflation stays above 3% into next year, a more substantial rise in bond yields could add to stock market volatility.
The main difference in views is the extent to which higher inflation stems from demand-supply imbalances associated with the pandemic or from the vigorous monetary and fiscal policy responses to it.
In articulating their view, Federal Reserve officials argue that the recent spike in inflation mainly reflects the effects from inflation being abnormally low one year ago when the pandemic struck. A vivid example of demand-supply imbalances is the four-fold increase in lumber prices through May 2021 that has been followed by a 40% decline since then. Another example is the 30% rise in prices of used cars in the twelve months ended May that has been linked to a global shortage of computer chips that impacted new car production. Excluding such highly volatile items, the median price increase has been contained, and the Fed anticipates that supply shortages will be alleviated as economic activity is restored.
The alternative view is that higher inflation is likely to persist, because monetary and fiscal policies have become highly accommodative to combat the pandemic. If they are not restrained, they could cause aggregate demand to outstrip supply and potential output well after the disruptions from the pandemic have passed.
On the monetary side, the Federal Reserve changed its operating procedures last summer to target an average annual inflation rate of 2%, and it no longer plans to raise interest rates pre-emptively when unemployment falls to low levels. On the fiscal front, the cumulative tally of government programs to combat COVID-19 now exceeds $7 trillion. This is substantially greater than the $800 billion stimulus program enacted in the wake of the 2008 Global Financial Crisis. On top of this, the Biden administration is now seeking to enact the largest expansion in federal programs since LBJ’s Great Society.
When the debate about inflation is framed in these terms, two things stand out. First, investors should be able to determine the impact of demand-supply imbalances as more businesses reopen in the remainder of this year. Second, it will take longer to ascertain the impact of policy changes. The outcome will ultimately hinge on whether the pace of activity exceeds the economy’s potential growth, the Federal Reserve’s response and how much of Biden’s fiscal programs are enacted.
Fed Policy: How Flexible Will It Be?
Until recently, Fed officials were adamant that higher inflation would be temporary and that the Fed had the tools to keep inflation in check. This stance caused some investors to worry that the Fed would be late in responding to evidence of higher inflation.
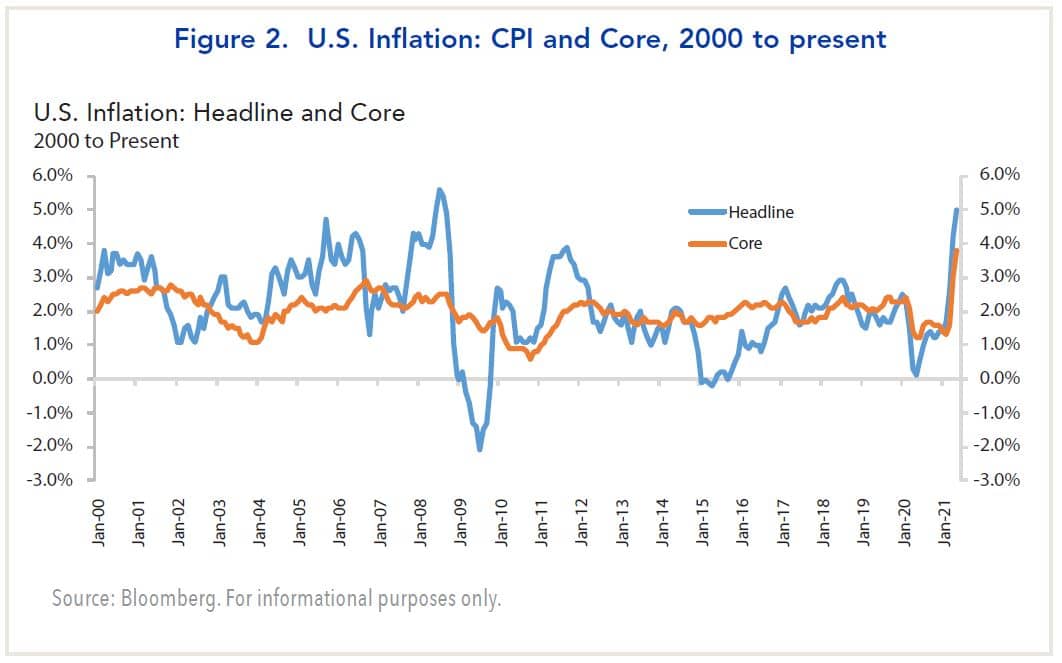
During the June FOMC meeting, however, Fed officials moderated their stance somewhat. First, they acknowledged that the economy and employment were strengthening and that inflation was running somewhat higher than it expected: The Fed revised its estimate of PCE inflation up by a full percentage point to 3.4% in 2021 (Q4/Q4) and core inflation to 3% from 2.2% (Figure 2).
Fed officials also moved forward their timetable of possible increases in the Fed funds rate, with the majority expecting the first hikes to occur in 2023, up from 2024 previously. During the press conference that followed, Fed Chair Jerome Powell struck a more dovish tone, stating that inflation expectations were moderate and the Fed had the necessary tools if they became unanchored.
Markets subsequently turned volatile, as the Treasury yield curve flattened while the stock market sold off and then rallied. Our take is that Fed officials are prudent to acknowledge that inflation may become an issue if the economy stays strong. However, because they have not spelled out how they would respond, investors will be attuned to any hints of policy changes. In this respect, we view the markets’ response as a preview of what could happen if policy were tightened.
Enacting Biden's Agenda
Following the outcome of the 2020 elections in which Democrats won both houses of Congress by the narrowest of margins, investors wondered whether Republicans and Democrats would be capable of compromising to make sound public policy decisions. Based on the extreme partisan wrangling over the past decade, the odds appeared slim to none. However, the negotiations over public infrastructure spending have raised hopes that a compromise might be reached for a pared-down bill.
The basis for optimism is the difference in the proposed spending for the two sides has narrowed from the original offers: The Biden administration has lowered its tally from $2.3 trillion to $1 trillion over eight years, while the Republicans upped theirs to nearly $1 trillion of which $579 billion represents new spending above baseline projections.
Hopes that a compromise had been reached were bolstered when Biden indicated his approval of an infrastructure plan that was agreed to by a group of Senate moderates from both parties. However, Biden subsequently threatened to veto the deal if it was not accompanied by a much larger spending bill that contained key elements of his social agenda.
The goal of the Democrats is to pass an omnibus spending bill via reconciliation that requires only a majority vote in the Senate. However, making it a precondition for passage of the infrastructure bill added to the complexity of passing it because Republicans are opposed to a large spending bill. Consequently, Biden walked back his comment when Republicans threatened to withdraw their support for the infrastructure bill.
While it is too early to tell what the outcome will be, the totality of government spending presented in the White House budget proposal is extremely ambitious. It calls for about $4 1/2 trillion in federal spending that would be offset by $3 1/2 trillion in tax increases over the next decade. If enacted, it would raise spending as a share of GDP to an average of 24.5% over the next decade, well above the 50-year average of about 20.5%, and the highest in U.S. peacetime history.
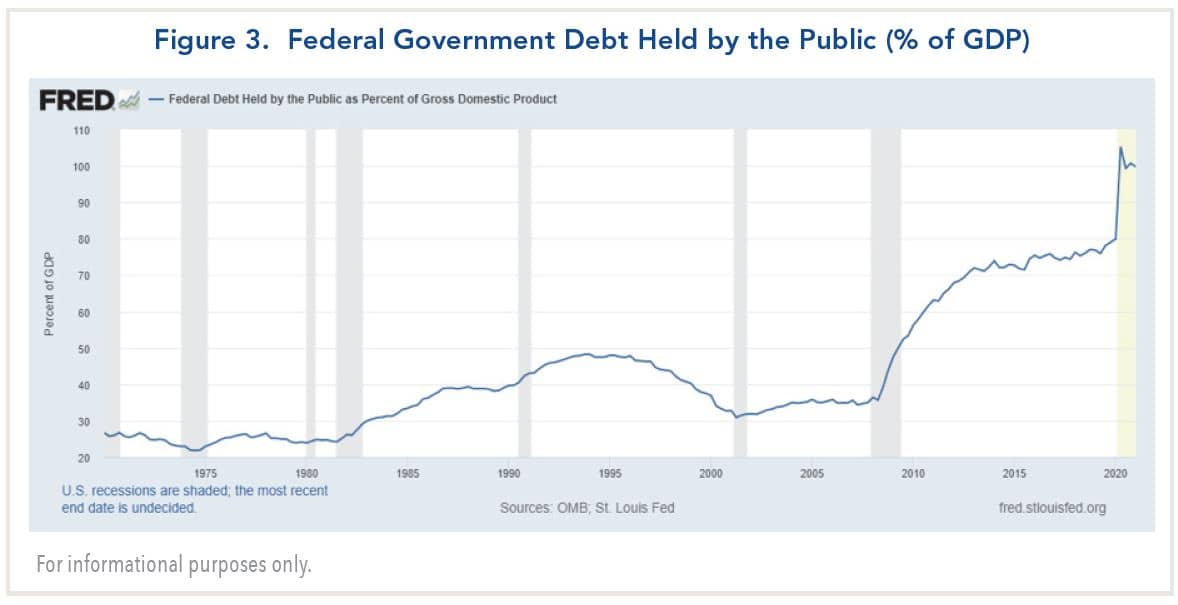
Even with favorable economic assumptions, the Biden administration acknowledges that deficits would average just over 5% of GDP in the coming decade, for a cumulative increase of $14.5 trillion. This would boost the ratio of publicly-held government debt to GDP to 113%, well above the peak of 107% following World War II (Figure 3).
The path of least resistance will likely be to pass spending initiatives that are not close to being fully funded. If so, it should place added pressures on the Federal Reserve to fund the government debt such that increases in interest rates are contained.
The basis for optimism is the difference in the proposed spending for the two sides has narrowed from the original offers: The Biden administration has lowered its tally from $2.3 trillion to $1 trillion over eight years, while the Republicans upped theirs to nearly $1 trillion of which $579 billion represents new spending above baseline projections.
Hopes that a compromise had been reached were bolstered when Biden indicated his approval of an infrastructure plan that was agreed to by a group of Senate moderates from both parties. However, Biden subsequently threatened to veto the deal if it was not accompanied by a much larger spending bill that contained key elements of his social agenda.
The goal of the Democrats is to pass an omnibus spending bill via reconciliation that requires only a majority vote in the Senate. However, making it a precondition for passage of the infrastructure bill added to the complexity of passing it because Republicans are opposed to a large spending bill. Consequently, Biden walked back his comment when Republicans threatened to withdraw their support for the infrastructure bill.
While it is too early to tell what the outcome will be, the totality of government spending presented in the White House budget proposal is extremely ambitious. It calls for about $4 1/2 trillion in federal spending that would be offset by $3 1/2 trillion in tax increases over the next decade. If enacted, it would raise spending as a share of GDP to an average of 24.5% over the next decade, well above the 50-year average of about 20.5%, and the highest in U.S. peacetime history.
Even with favorable economic assumptions, the Biden administration acknowledges that deficits would average just over 5% of GDP in the coming decade, for a cumulative increase of $14.5 trillion. This would boost the ratio of publicly-held government debt to GDP to 113%, well above the peak of 107% following World War II (Figure 3).
The path of least resistance will likely be to pass spending initiatives that are not close to being fully funded. If so, it should place added pressures on the Federal Reserve to fund the government debt such that increases in interest rates are contained.
Positioning Investment Portfolios
Weighing these considerations, we are maintaining an overweight position in equities and other risk assets relative to bonds. Our reasoning is stocks should be supported by a strong economy and a powerful rebound in corporate profits. Also, while equities appear expensive when valued by traditional measures such as forward P/E multiples and the Cyclically Adjusted PE (CAPE) measure, the equity risk premium relative to bonds indicates stocks are fairly valued relative to bonds.
For reasons cited previously, the main factor that would cause us to reassess our view would be a sustained rise in inflation. However, we believe it is premature to make a call at this time.
For reasons cited previously, the main factor that would cause us to reassess our view would be a sustained rise in inflation. However, we believe it is premature to make a call at this time.