It’s been a long time since Americans have had to contend with inflation. Both the CPI and core rate of inflation that excludes food and energy have been comfortably below the Fed’s annual target of 2% for the past decade. Previously, there was a secular decline in inflation from a peak rate in the low double digits in the early 1980s to an average annual rate of about 2.5% in the next two decades.
The last inflation scare occurred after the 2008 global financial crisis (GFC), when investors worried that a massive injection of reserves into the banking system by the Federal Reserve would rekindle inflation. But it proved short-lived when banks opted to hold excess reserves rather than make loans that would have expanded the money supply. As a result, both wage and price inflation have been well anchored at low levels.
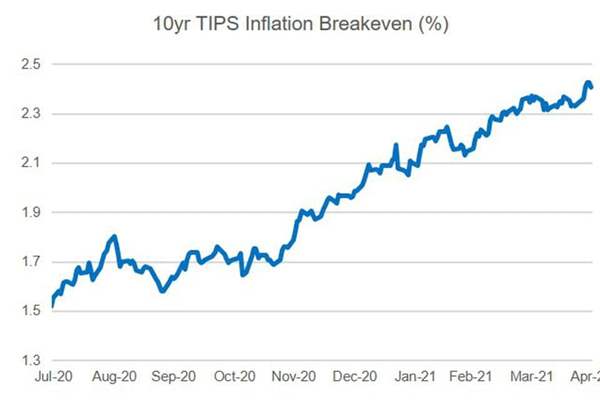
More recently, however, inflation expectations as measured by the breakeven rate between yields on 10-year Treasuries and TIPS have begun to edge higher (see chart). Also, earnings reports for the first quarter suggest an increasing number of companies are beginning to raise prices. This poses the question of whether we could be on the cusp of higher inflation.
The principal reason for considering this issue is the U.S. economy is poised for a very powerful liftoff. Government programs to combat COVID total $6 trillion over the past year, or more than 25% of GDP. They boosted personal disposable income in March by 28% above its pre-pandemic level and personal savings by $2.2 trillion, more than 15% of GDP.
These developments suggest there is considerable pent up demand to spend as key sectors of the economy such as travel and leisure reopen. Consequently, projections of economic growth for 2021 have increased to 6%-7% from 3%-4% at the beginning of this year, with growth likely to be above average next year, as well. This outlook raises the specter that the economy could overheat at some point.
For its part, the Federal Reserve is sanguine that any increase in inflation above its 2% average annual target is likely to be temporary. The Fed foresees inflation climbing above that level in the near term, but it believes wage increases will stay tame. The reason: Unemployment is elevated at 6.1% and more than eight million workers are out of jobs since the pandemic struck a year ago.
Still, the Fed’s assessment could be too sanguine. The closest parallel with today is the second half of the 1960s, when inflation surged to a 4.5% annual rate from 1.5% in the first half. The driving forces were large increases in government spending to fight the Vietnam War and the “War on Poverty” coupled with a highly accommodative monetary policy that kept interest rates artificially low.
The early signs of inflation then were steady increases in commodity prices and precious metals and pressures on the U.S. dollar. Like the Fed, most people shrugged them off. By 1971, however, these pressures became so great that the U.S. dollar was devalued for the first time, and it subsequently was allowed to float in early 1973. By that time, evidence of wage and price inflation was rampant, and investors flocked to real assets as a hedge against inflation.
In the current context, producer costs have been increasing significantly driven by higher costs of commodities and materials, especially lumber and copper. The producer price index for final demand increased by 4.3% over the past 12 months and at a 7.6% annual rate in the last six months. Beyond the data, people can see signs of inflation first hand as they shop for groceries, purchase used cars and rent them.
Another clear sign of inflation is the U.S. housing market: Home prices are up by more than 10% in the past year. Housing demand is solid at high levels of activity, supported by low mortgage rates and an improving labor market. There is also a shortage of homes in many markets, and with inventories low it will take builders several years to meet the strong demand.
One of the main differences from the late 1960s is that wage increases have been moderate thus far. That said, labor shortages are emerging in parts of the country and in certain industries where jobs openings are rising. In the wake of the COVID pandemic, some people have decided to work less for personal reasons, while others find that elevated unemployment compensation creates disincentives for them to find new jobs. Therefore, the labor market may be tighter than commonly believed.
Another difference is the U.S. dollar has been stable-to-firm against the key currencies this year. One reason is that most central banks have been pursuing highly accommodative monetary policies similar to the Fed’s. The dollar is also supported by strong U.S. economic growth, which has caused U.S. bond yields to rise relative to those abroad.
Weighing these considerations, my take is a repeat of the 1960s and 1970s is unlikely, but investors should not be complacent about the risk of higher inflation. Both the size of government spending and the rise in money supply swamp what occurred during the 2008 GFC. Moreover, a powerful recovery is underway that will likely result in the economy approaching its productive potential by next year.
If so, the case for the Federal Reserve to taper bond purchases and to raise interest rates will become compelling well before its expected timetable of 2024. The longer it delays, the greater is the risk that an increase in inflation expectations could become entrenched.
A version of this article was posted to Forbes.com on May 6, 2021.