- The U.S. economy is poised for a powerful expansion as the COVID pandemic is brought under control and the effects of two relief packages totaling $2.8 trillion work their way through the economy. While the outlook is positive, some observers are concerned the economy could overheat and spawn inflation.
- Treasury bond yields rose by about 80 basis points in the first quarter in response to these developments. However, the Federal Reserve does not foresee inflation as a problem, and it does not expect to raise interest rates for several years.
- The U.S. stock market posted record highs despite the increase in bond yields. However, there has been a rotation away from tech stocks into cyclical stocks and the prospect of a corporate tax hike to finance a $2 trillion public infrastructure program is looming.
- Our assessment is that markets are likely to be choppy as the economy accelerates and inflation approaches the Fed’s 2% threshold. But the main test for the Fed is likely to come beyond this year when the economy is closer to its potential. Meanwhile, we are overweighting stocks relative to bonds in balanced portfolios.
Financial Market Cross Currents
Over the past twelve months, investors have had to contend with the worst public health crisis in modern history that led to unprecedented shutdowns of businesses and social distancing. Amid the uncertainty, those who banked on federal programs and Federal Reserve support to bolster the economy until vaccines could be developed were rewarded handsomely for bearing risk. As shown in Figure 1, U.S. stock market returns were in the range of 55% for the S&P 500 Index to nearly 95 % for the Russell 2000 Index over this period. At the same time, returns for investment grade and high yield bonds were between 7.9% and 23.7%.
Figure 1: Investment Returns by Asset Class (in percent)
| STOCK MARKET | march 31, 2020 - march 31, 2021 | December 31, 2020 - march 31, 2021 |
|---|---|---|
| U.S. (S&P 500) | 56.3 | 6.2 |
| Russell 2000 | 94.8 | 12.7 |
| NASDAQ | 73.5 | 3.0 |
| International (EAFE $) | 45.3 | 3.6 |
| Emerging Markets (MSCI $) | 58.9 | 2.2 |
| U.S. Bond Market | MARCH 31, 2020 - MARCH 31, 2021 | DECEMBER 31, 2020 - MARCH 31, 2021 |
|---|---|---|
| Treasuries | -4.4 | -4.3 |
| IG Credit | 7.9 | -4.5 |
| High Yield | 23.7 | 0.8 |
The key development in the first quarter of this year was a surge in Treasury bond yields of about 80 basis points. It reversed the decline following the onset of the COVID pandemic last March and resulted in bonds generating negative returns during the first quarter of minus 3.4% for the Barclay’s Aggregate Index.
The principal factor behind the rise in bond yields is growing optimism about the U.S. economy and the possibility of higher inflation. In late 2020, for example, most forecasts envisioned real GDP growth this year would be in the vicinity of 4%. However, when Congress passed a $0.9 trillion relief package in the final week of 2020 and a subsequent package totaling $1.9 trillion was enacted in March, forecasters revised their growth projections substantially higher. The consensus currently is growth will be between 6%-7%, with some forecasts as high as 8%- 9%, which would be one of the highest rates in the post-war era.
The March employment report adds to investors’ conviction that growth is about to surge. The increase in non-farm payrolls of 916,000 was the strongest since last summer and lowered the jobless rate to 6%.
Worries About Overheating
Passage of President Biden’s $1.9 trillion COVID relief bill in March has been heralded as the most significant legislation in more than a generation. It comes on top of a $0.9 trillion package enacted at the end of last year, and it provides a bridge for low-to-middle income households to cope financially until vaccines enable the U.S. economy to function normally.
Beyond this, an ambitious legislative program is in the works that will include a major infrastructure program and a plan to develop green energy projects. The combined cost could be in the vicinity of $2 trillion over the coming decade and will include corporate tax increases to finance it if it is enacted. It is to be followed by a second plan focused on child care, healthcare and education that will be unveiled in April. At this juncture it is too early to assess what the final bills will look like. However, they are expected to encounter stiff opposition from Republicans, and it may be difficult to retain the full support of Democrats.
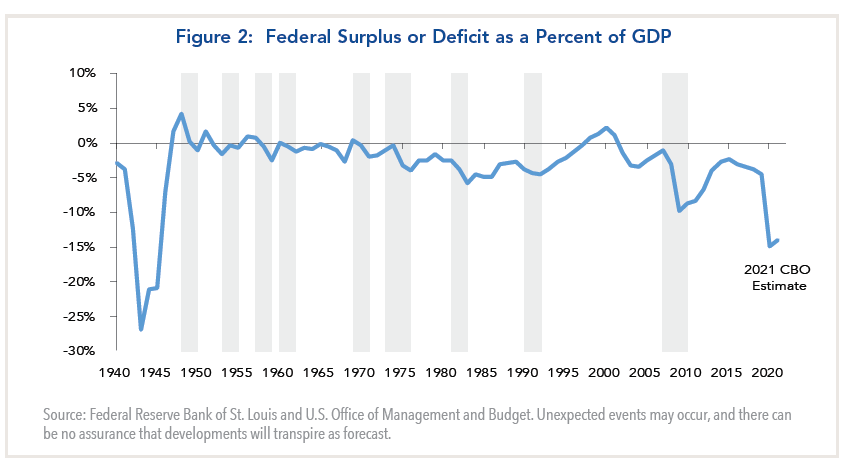
The main issue for investors is what the budgetary impact of increased federal spending will be. Last year, the federal deficit ballooned to a post-war high of about 14% of gross domestic product (GDP), and it currently is on pace to rival that level this year (Figure 2). This has caused some observers including former Treasury Secretary Lawrence Summers to note the risk that the stimulus could cause the economy to overheat and generate higher inflation and interest rates.1
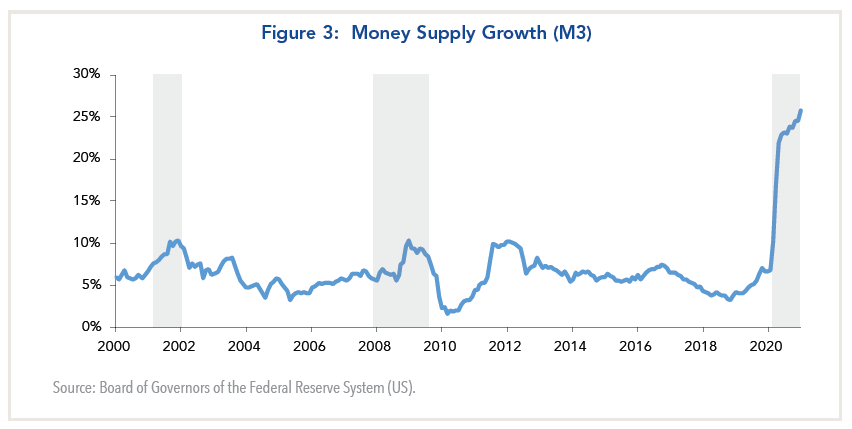
This view is enunciated by Michael Bordo and Mickey Levy, who have studied the relationship between expansionary fiscal policies and inflation for over two centuries.2 The authors note that a key difference from the 2008 Global Financial Crisis is the money supply has surged this past year partly as a result of excess saving associated with COVID transfer payments (Figure 3).

 Meanwhile, the increase in federal debt outstanding has created a situation of “fiscal dominance” in which the Fed is compelled to keep interest rates low for the foreseeable future to keep the government’s debt service costs manageable. For some observers, this predicament is similar to what occurred in the mid-late 1960s when LBJ proclaimed the “Great Society” while the Vietnam War was being ramped up.
The Federal Reserve Stays the Course
Nor are Fed officials worried about a permanent surge in inflation. The latest projections in the March FOMC briefing show that they anticipate that core inflation could be in the range of 2.0%-2.5% this year due to supply bottlenecks as the economy gains momentum. However, the run-up is expected to be temporary, and over time inflation is expected to revert to the Fed’s long-term target of 2%.
Based on these expectations, Fed officials do not envision raising interest rates until 2024. By comparison, the Treasury market is pricing in a Fed rate hike as early as next year, with steady increases over the next two years that would take the funds rate to about 2.5% by 2024.
U.S. Stock Market Rally
Depending on the valuation metrics used, the broad market appears to be fairly valued when compared with bonds and expensive when measured on a one year forward P/E multiple basis. The run-up in bond yields thus far has not triggered a market correction, because they are viewed as a natural response to stronger growth. However, should inflation accelerate as some point well beyond the Fed’s 2% threshold, a market correction would be more likely.
Another risk factor is the possibility that the Biden administration will seek to boost the corporate tax rate from 21% to 28% to help finance increased spending on public infrastructure. At this juncture, however, it is too early to assess the likelihood of such a program being enacted.
Investment Implications
With respect to bond portfolios, we are underweight duration in anticipation that bond yields could rise further as growth accelerates, and we are overweighting credit risk. It is possible that the 10-year Treasury yield could test the 2% level at some point, but we do not anticipate a rise well beyond that level this year.
In the case of equities, our assessment is the broad market is reasonably valued overall. However, there could be a further rotation away from technology to cyclicals if the economy strengthens and interest rates continue to climb.
1“How Larry Summers went from Obama’s top economic adviser to one of Biden’s loudest critics.” David J. Lynch, Washington Post, March 29, 2021.
2“Do Enlarged Fiscal Deficits Cause Inflation: The Historical Record,” NBER working paper 28195, December 2020.


