The widely followed Case-Shiller index showed housing prices at the national level increasing in May by more than 15% a year, the fastest pace in 30 years. According to the National Association of Realtors, the median existing home price sale exceeded $350,000, representing nearly a 24% rise in the twelve months ended May.
Desmond Lachman of AEI argues that, adjusted for inflation, U.S. housing prices are higher than they were at their peak in 2006. He fears the Federal Reserve could make the same mistake it did then when it kept interest rates artificially low. The Fed’s actions fueled the housing boom by making credit readily available at very low interest rates.
Lachman is particularly critical of the Fed continuing to buy $120 billion a month in U.S. Treasuries and mortgage-backed securities (MBS) when the economy shows signs of over-heating. He writes: “By doing so, not only is the Fed further inflating the U.S. housing market bubble but it is also inflating the global everything bubble.”
My own take is that some of the criticisms of Fed policy are valid. However, it is not clear that surging housing prices constitute a housing bubble.
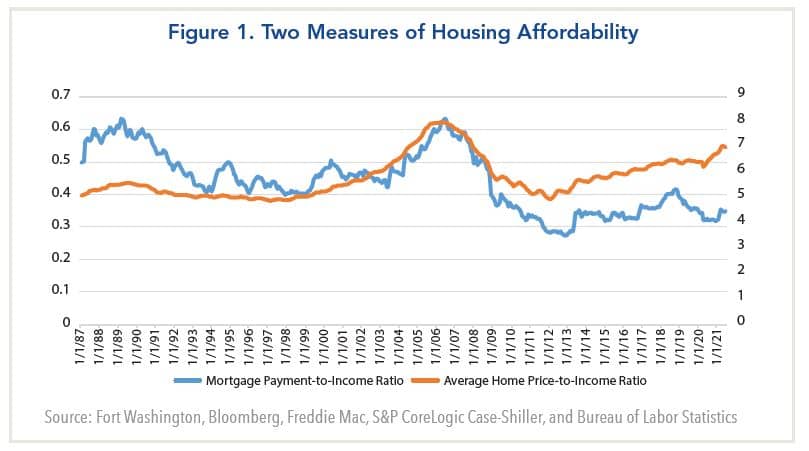
In this regard, it is useful to look at two metrics of home price affordability shown in the chart below. The orange line is the ratio of the average home price to income based on average hourly earnings. It shows home prices are elevated today at about 7 times versus a historic average of 5 times. Using this metric, the housing market appears very pricy for many Americans.
The white line, by comparison, shows the ratio of monthly payments (based on the cost to finance the average home price at the prevailing 30-year fixed rate mortgage) versus income. This ratio shows valuations are in the middle of the range in the post Global Financial Crisis (GFC) period.
The chart illustrates how low interest rates have made housing prices affordable for Americans despite the surging prices. At the same time, it suggests they could become less affordable if the Fed were to raise interest rates significantly. Based on statements by Fed officials this is not likely anytime soon. However, the Fed could influence mortgage rates if it slowed its purchases of MBS.
Desmond Lachman of AEI argues that, adjusted for inflation, U.S. housing prices are higher than they were at their peak in 2006. He fears the Federal Reserve could make the same mistake it did then when it kept interest rates artificially low. The Fed’s actions fueled the housing boom by making credit readily available at very low interest rates.
Lachman is particularly critical of the Fed continuing to buy $120 billion a month in U.S. Treasuries and mortgage-backed securities (MBS) when the economy shows signs of over-heating. He writes: “By doing so, not only is the Fed further inflating the U.S. housing market bubble but it is also inflating the global everything bubble.”
My own take is that some of the criticisms of Fed policy are valid. However, it is not clear that surging housing prices constitute a housing bubble.
In this regard, it is useful to look at two metrics of home price affordability shown in the chart below. The orange line is the ratio of the average home price to income based on average hourly earnings. It shows home prices are elevated today at about 7 times versus a historic average of 5 times. Using this metric, the housing market appears very pricy for many Americans.
The white line, by comparison, shows the ratio of monthly payments (based on the cost to finance the average home price at the prevailing 30-year fixed rate mortgage) versus income. This ratio shows valuations are in the middle of the range in the post Global Financial Crisis (GFC) period.
The chart illustrates how low interest rates have made housing prices affordable for Americans despite the surging prices. At the same time, it suggests they could become less affordable if the Fed were to raise interest rates significantly. Based on statements by Fed officials this is not likely anytime soon. However, the Fed could influence mortgage rates if it slowed its purchases of MBS.
One key difference from the mid-2000s is that credit standards for mortgages are considerably stricter today. This is evinced by a dearth of products that are structured to make homes look affordable such as teaser interest rates that start out low but can rise significantly over time. For the most part, financial institutions have also been more circumspect in ensuring that borrowers have the wherewithal to service their debt, although there has been a pickup in subprime mortgages recently.
Another important difference is the underlying demand-supply conditions for housing. During the housing boom of the mid-2000s, the existing inventory of homes was substantial, reaching a peak of 3.8 million units in 2007. The rapid price appreciation then mainly stemmed from the expanding pool of potential new buyers as credit conditions were relaxed.
Since then, housing inventories have shrunk steadily and they have fallen to just 1.2 million units recently, an all-time low. In these circumstances, any increase in demand can have a large impact on home prices. It is a key reason why potential home buyers are frustrated when they have to enter a bidding war and pay more than the list price to secure a transaction.
In short, whereas rapid home price appreciation in the mid-2000s occurred despite record high supply, it is now occurring because supply is at record lows.
Finally, the COVID-19 pandemic has also had an important influence on the U.S housing market: Home-owners have shifted from densely-populated urban areas to suburbs or locations that are deemed to be more desirable. In April, for example, annual home price appreciation for suburban and less dense cities reached 12% versus 2% for dense urban areas.
The cities that have experienced the most rapid home price appreciation include Denver, Phoenix, San Diego, Seattle and Tampa. By comparison, those that have posted the slowest home appreciation include Atlanta, Chicago, Minneapolis, New York and San Francisco.
At the national level, the pandemic has produced areas that can be considered “winners” and “losers” as people migrate. This is similar to the stock market, where industries such as technology and finance were able to thrive while others such as travel and leisure suffered. That said, nearly all geographic areas have experienced some home price appreciation over the past year.
Weighing these considerations, a replay of the housing bust of 2007-2008 appears unlikely. Instead, the more likely outcome is home price appreciation will slow over time as houses become less affordable and the Fed tightens monetary policy. At that time, some of the fastest rising markets could experience some price retracement, but a sustained decline in housing prices nationally is less of a risk.
A version of this article was posted to Forbes.com on July 12, 2021.