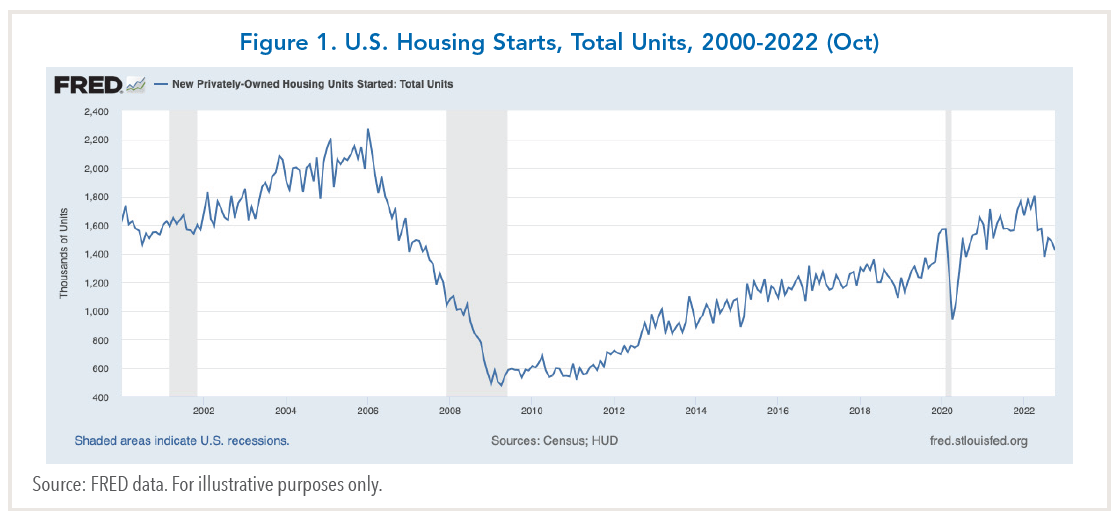
The silver lining is that most forecasters envision a mild and short recession -- lasting eight months versus the post-war average of 10 months. However, this begs the question of whether or not forecasters could be wrong like they were in 2008-09. They failed to anticipate the Global Financial Crisis (GFC), which was the worst recession in post-war history, despite housing starts peaking in early 2006 and plummeting by nearly 80% over three years (see chart below).
The Likelihood of a U.S. Housing Slump
Regarding the first issue, a U.S. housing slump is very likely. The reason: the combination of a 40% spike in housing prices since the onset of the Covid-19 pandemic in early 2020, and a more than doubling in mortgage rates since the beginning of 2022 has made homes unaffordable for many Americans.
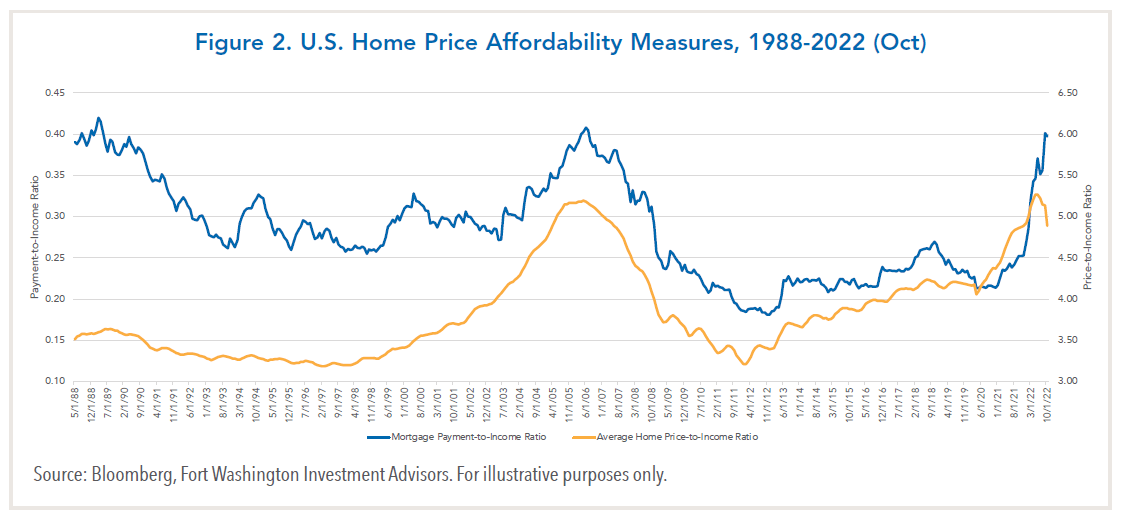
Two measures of affordability – mortgage payment to income (orange line) and average home price to income (blue line) are at their highest levels since the mid-2000s (see chart below). The impact is already apparent in new home sales, which have fallen for nine consecutive months --about 40% below their peak in 2020.
The Potential Economic Impact of a Housing Bust Today Compared to 2008-2009
U.S. housing prices have softened recently, after rising in the first half of the year. The main factor bolstering prices is the tight inventory of homes available for sale, which are nearly 70% below mid-2000 levels. This is a key difference that lessens the prospect for a repeat GFC.
How housing prices fare in the next year or two will hinge on where mortgage rates settle. For example, an outlier forecast by the Federal Reserve Bank of Dallas sees home prices plunging by as much as 20% if mortgage rates rise further. The consensus view is a peak-to-trough price decline of about 10%. This would still leave homes unaffordable for many Americans, unless mortgage rates ease to about 5%. Beyond this, two factors are likely to influence the U.S. economy’s vulnerability to a housing decline.
One factor is leverage in the U.S. household sector. An IMF study by researchers at the University of Chicago Booth School of Business found that leverage, measured by the ratio of U.S. household debt to income, was a powerful predictor of the severity of the 2007-2009 recession. During the period prior to the recession, the ratio reached its highest level since the onset of the Great Depression. Today, by comparison, the ratio is considerably lower – by about 20%. Furthermore, household debt service payments as a percent of personal disposable income are currently about 9.5% versus 13% in 2007. The main reasons are households took on much less debt after the GFC, and mortgage rates were well below pre-crisis levels until this year. The second factor relates to how exposed the financial system is to housing. Financial institutions played a prominent role in boosting housing demand during the 2000s by enabling borrowers who would not have previously qualified to obtain mortgages. To qualify subprime borrowers, lenders lowered underwriting standards and made the terms attractive by granting variable-rate mortgages with teaser rates for the first year.
When debt-servicing problems became apparent in 2007, it was difficult to ascertain how exposed financial institutions were because underwriters securitized mortgages and sold them. Credit markets, in turn, seized up as financial institutions became reluctant to rollover existing debt obligations.
By comparison, the financial system today is less vulnerable to a housing downturn for several reasons. First, the credit quality of mortgages is much higher today, with two-thirds of all mortgages going to prime borrowers with FICO credit scores over 760. Only 4% of new mortgages are to subprime borrowers versus an average of 13% during the 2003-2007 period. The percentage of fixed-rate mortgages is also much higher today.
In addition, financial institutions are more highly capitalized today. Consequently, the likelihood of a severe “credit crunch,” in which financial institutions refrain from extending credit, is lower.
In sum, the tightening of monetary policy by the Federal Reserve this year has increased the risk of a housing downturn and a U.S. recession next year. However, the factors that contributed to the severity of the 2007-2009 recession are less apparent now. Therefore, the probability of a replay of the 2008-09 GFC is not high.
A version of this article was posted to Forbes.com on December 1, 2022.