- The current economic expansion is about to surpass the ten-year mark, which would make it the longest in U.S. history. While investors worried its days might be numbered late last year, the stock market has gone on to set new record highs amid optimism the expansion will continue into next year and possibly beyond.
- This poses the question: What could end it? The most common factor is Fed tightening to curb inflation. However, inflation risks have lessened amid improved productivity growth and moderate wages, and the Fed is now on hold.
- Alternatively, periods of low inflation tend to be associated with asset bubbles that are fueled by low interest rates and rapid credit expansion. However, they are less apparent now than during the tech and housing bubbles.
- The primary risk today is that policymakers have limited options to counter the effects of shocks to the global economy.
Background: Anticipating the Longest Expansion
The U.S. economic expansion will reach its 10th anniversary in June, matching the longest one on record from March 1991 until March 2001 (Figure 1). By all odds, it should go on to set a new record, and some forecasters are now calling for it to last another 1-2 years. This represents a dramatic reversal from views of market participants late last year, when investors fretted that the combination of Fed tightening, the U.S.-China trade conflict, and a world-wide economic slowdown would spawn a recession.
| Business Cycle Trough | Expansion in Months (trough to peak) |
|---|---|
| Nov. 1970 (IV) | 36 |
| March 1975 (I) | 58 |
| July 1980 (III) | 12 |
| Nov. 1982 (IV) | 92 |
| March 1991 (I) | 120 |
| Nov. 2001 (IV) | 73 |
| June 2009 (III) | 118 (April) |
Source: National Bureau of Economic Research.
Investor optimism has returned since then, as the Fed has signaled it is on hold for the foreseeable future and an agreement on U.S.-China trade is pending. Recent developments have decreased chances of a comprehensive trade deal with China in the near-term, but we expect the two countries will continue working toward a resolution. The U.S. economy also fared better-than-expected in the first quarter, posting annualized growth of 3.2%. While this figure was boosted by temporary factors such as a large inventory accumulation and a surprising improvement in U.S. trade, the underlying growth trajectory appears to be in the vicinity of 2.2% - 2.5%. This is a solid showing, considering the headwinds late last year and the beginning of this year.
Some investors may still be worried that the expansion is long in the tooth. However, most economists do not believe expansions die of old age. Rather, they typically end as a result of one of the following factors: (i) increased inflation, which results in the Fed raising interest rates beyond levels that are sustainable; (ii) the bursting of asset bubbles that are spawned by low interest rates and rapid credit expansion; and (iii) external shocks that disrupt world financial markets. Accordingly, we assess how each of these factors look today.
Surprises, Reasons & Consequences
One surprise is how tame inflation has stayed throughout the expansion: Both headline and core inflation, which exclude the volatile food and energy components, currently are below the Fed’s target of 2%. This has occurred even though labor market conditions have tightened, with the unemployment rate dropping to 3.6% in April - the lowest level in nearly 50 years.One reason is that the pool of labor has expanded more than expected. After labor force participation rates declined materially following the 2008 global financial crisis, they have been rising gradually as discouraged workers re-entered the labor force until April, when they fell. If this pattern resumes, it suggests the labor market may not be as tight as the standard measures of unemployment suggest.
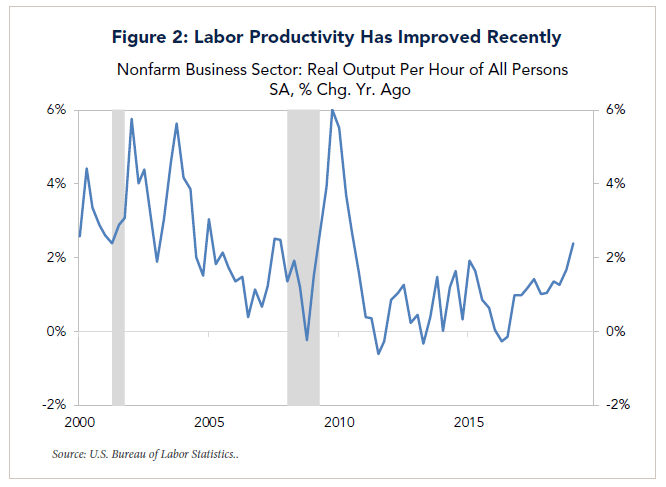
One consequence is that wage increases have been rising gradually, with average hourly earnings approaching 3.3% from 2.5% two years ago. Normally this would have led to some price pressures. However, it did not happen, because the wage pickup has been accompanied by an improvement in labor productivity. During the first quarter of this year, for example, nonfarm productivity – real output per hour worked – rose by 2.4% over a year ago. It resulted in unit labor costs – compensation per hour divided by productivity - being little changed from a year ago.
A grey area is how long the improvement will last. Productivity increased by only 0.7% annually between 2012 and 2016, but it has accelerated since then, averaging 1.2% in 2017-18, before the pop in the first quarter of this year (Figure 2). While many economists believe the latest uptick will be temporary, the improvement over the past year has coincided with cuts in business taxes that were enacted and deregulation initiatives.1
Another favorable development has been the acceleration in investment in intellectual property to more than 8% annualized over the past five quarters. It accounts for one third of total business fixed investment. In this respect, what is happening today is reminiscent of the tech boom of the late 1990s, albeit on a smaller scale.
 The bottom line is the Federal Reserve is unlikely to tighten monetary policy as long as inflation remains under control. Indeed, market participants believe the Fed now has room to make pre-emptive rate cuts in the future should the economy show signs of softening. If so, one of the main risk factors that could end the economic expansion has lessened.
Lessened Risk of an Asset Bubble
Even if inflation stays low, there is still a risk that a bubble in asset prices could abort the expansion. This was the case, for example, in the recessions that accompanied the bursting of the tech bubble in the early 2000s and the housing bubble in the mid-late 2000s. However, we do not detect extreme valuations in asset prices today.The bull-run in U.S. stocks that began in March 2009 has been supported by a surge in corporate earnings that has seen profit margins rise to record levels. Last year, profits received an added boost from the tax cuts that were enacted, and S&P 500 earnings rose by more than 20%. The consensus forecast for this year calls for slower growth in the mid-single digit range, as the effect of tax cuts fades and the pace of economic activity moderates. While some forecasters have called for an “earnings recession” in the first half of this year, results for the first quarter have been slightly positive thus far.
Our take is that equity valuations are neither cheap today, nor unusually stretched. The same is true for valuations for investment-grade and high yield bonds: Yield spreads versus Treasuries are near mid-points of their historic ranges.
An area that has come under scrutiny, however, is housing. Real housing prices have rebounded by nearly 40% from their 2012 trough. Today they are only 10% shy of their 2006 peak. However, as Kim Schoenholtz of NYU notes, most other indicators of U.S. housing conditions give notably less cause for concern. They include the OECD’s U.S. housing price-to-rent ratio, the price-to-income ratio (a measure of housing affordability) and the ratio of housing wealth to the service flows from housing (an indicator analogous to a price-earnings ratio).
Furthermore, housing–related credit indicators appear fairly benign, owing to stronger underwriting standards: The expansion of mortgage debt in recent years reflects borrowing by households with prime credit scores. Also, the share of homes with negative equity dropped to 4.2% at the end of 2018, down from 25% as recently as 2011.
Schoenholtz goes on to consider the findings from a new metric – House Prices at Risk (HaR) – which the IMF created to assess the likely scale of a housing price bust conditional on a bad state of the world. This measure is developed to focus on long-tail events. Specifically, it measures the 5th percentile of the distribution of house prices one-to-three years forward. The main finding of the latest IMF report is that in contrast to the run-up to the financial crisis, the HaR metric does not signal a major threat either domestically or abroad. In sum, using this and more traditional measures, the risk of another housing bust leading to a financial crisis is relatively low today.
Slump in Global Manufacturing Lingers
The main risk that we have been focusing on is the softness in the manufacturing and trading sectors of the world economy. While GDP reports for the U.S., China and Europe all turned out better than expected in the first quarter, purchasing manufacturers index (PMI) surveys globally indicate continued softness in that sector. The global PMI, for example, fell to 50.6 in April from 51.3 in March, mainly dragged down by readings in the U.S., Brazil, and India, with the U.S. new orders component posting a large decline. The encouraging news is that the PMI in China has begun to stabilize, and that in the euro area PMI ticked up for the first time in 15 months.Amid this, there has been a steady decline in world trade volume (exports plus imports) over the past year. This development is associated with increased tariffs the U.S. imposed on China and other trading partners last year. Consequently, some observers anticipate world trade volumes will stabilize once an agreement is reached between the U.S. and China. However, it is too soon to tell.
Even if manufacturing and trade were to stabilize, there is still risk that an adverse shock – such as derailment of U.S.-China accord, higher oil prices, Brexit, or a currency crisis in Turkey – could spread to other countries. With interest rates at record lows or negative in many countries while government debt levels are high, policy options to counter economic weakness are more limited than in the past. Consequently, it is unclear what policymakers can do in the event of an external shock, and how effective their responses would be.
Conclusion: The U.S. Expansion Lives On, but the Global Outlook Is Mixed
Weighing these considerations, the most likely outcome is the U.S. economic expansion will continue through the balance of this year and into 2020. The improvement in productivity in the past five quarters has contributed both to an acceleration in U.S. growth and to stable inflation. Insofar as the productivity boost is linked to corporate tax cuts and deregulation, the recent stock market optimism is understandable. However, because some of the improvement in productivity may be transitory, investors should not over-react, especially when one considers the lingering risks in the global economy and the limited options policymakers have today should something go awry.1For further discussion, see the May 3 commentary by Mickey Levy of Berenberg Securities.
2Kim Schoenholtz, “Housing Prices at Risk,” Money, Banking and Financial Markets, April 29, 2019.