Investors, however, do not appear rattled by the news: Ten-year Treasury yields are little changed at just over 1.5%. This implies they are willing to accept a negative real yield of more than 2 percent for the privilege of holding government debt.
A common explanation is investors buy the Fed’s argument that the pickup in inflation is mainly due to global supply-chain problems emanating from the pandemic. While officials now acknowledge the supply disruptions could linger well into next year, the Fed’s forecast for 2022 calls for core inflation to slow to 2.3%, which is close to its 2% average annual target.
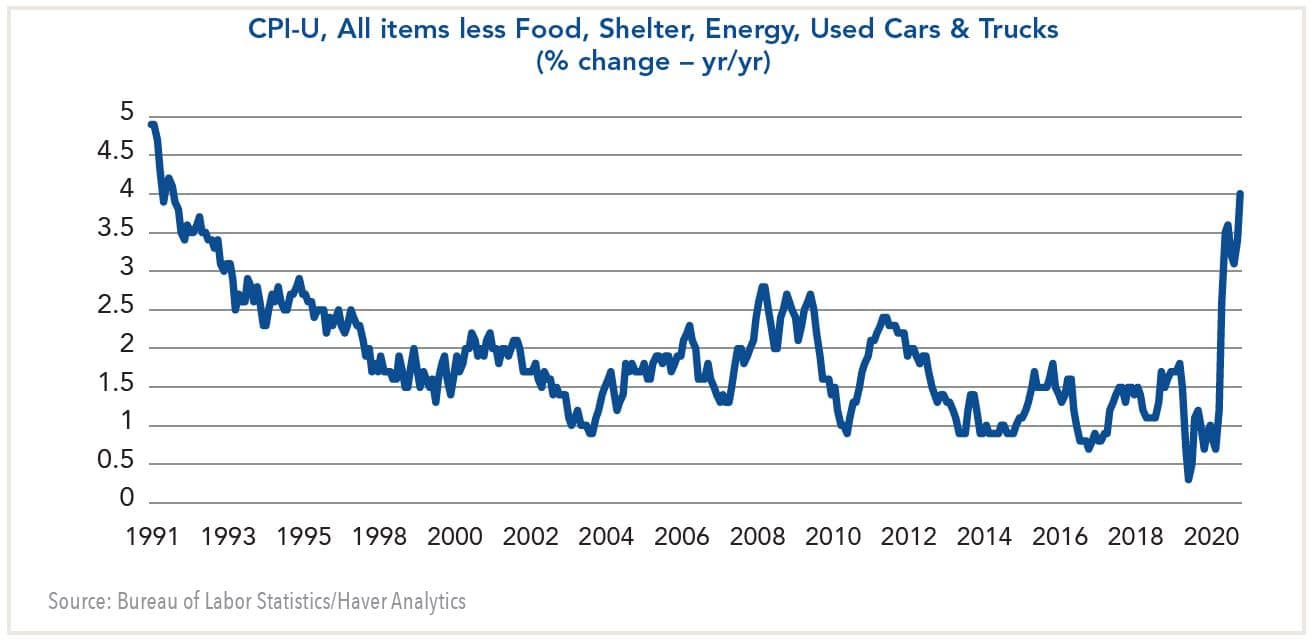
One problem with this rendering is that inflation readings show that price increases have broadened considerably in recent months. The surge in the October CPI, for example, showed monthly increases in gasoline prices of 6%, food costs of 1%, and owners-equivalent rent of 0.4%, respectively. Even when these items are excluded along with used cars and trucks, inflation for the remaining items in the CPI has increased to 3.5% year to year (see chart).
 An alternative explanation put forth by Cornerstone Macro is that there has been a regime shift in the way the treasury market functions since the Global Financial Crisis (GFC).1 Namely, the correlation between real GDP growth and real yields has been zero since 2010.
According to Roberto Perli, the principal reason is central bank repression of short term interest rates via massive purchases of government bonds over the past decade. With the Fed now holding nearly 30% of all treasury notes and bonds, it has greater command of the treasury market than in the past. Meanwhile, the Fed’s long-term forecast for the funds rate has fallen from 4.3% in 2012 to 2.5% today. By comparison, forecasts based on traditional fundamentals—GDP and inflation—suggest the 10-year Treasury yield should be closer to 5.5%.
The question this analysis raises is how long the regime of central bank repression will last.
If the Fed’s inflation forecast is correct, yields could stay lower for longer. In that case, Cornerstone Macro’s model envisions the 10-year Treasury yield creeping gradually higher to 1.8% by year-end 2022.
However, if the Fed’s forecast is wrong and inflation stays elevated at say 3%-4%, all bets are off. In these circumstances, pressure on the Fed to tighten monetary policy is likely to come from consumers who see their purchasing power eroding by higher costs. The NY Fed’s survey for October showed households now expect CPI inflation will be 5.7% in the next 12 months and will average 4.2% annually over the next three years. Moreover, consumer confidence as measured by the Michigan survey has failed to recover from the lows of the Delta wave due in part to concerns about inflation.
If so, the Fed cannot afford to stand pat. It is about to begin tapering purchases of government bonds and mortgage-backed securities and expects to wind them down by mid-2022. At that time, bond investors believe the Fed will begin to raise the federal funds rate gradually—by about 25 basis points per quarter through 2023 before leveling off at 1-1/4%.
Simply put, I find the bond market’s forecast to be ludicrous. Do investors really believe a 125 basis point increase in short rates will curb inflation pressures when the economy is growing faster than its long-term potential and is rapidly approaching full employment?
Moreover, should the Fed keep interest rates near zero until the second half of next year?
As is often the case with policymakers, the Fed appears to be fighting the last battle. One year ago, the Fed announced it would no longer be proactive in curbing inflation and would instead target attaining maximum employment. This meant it would not only accept a historically low unemployment rate of about 3.5%, but would also aim for the labor force participation rate to recover from the covid-19 pandemic.
Yet, even if the participation rate recovered fully, labor shortages may persist. The latest Jobs Opening and Labor Turnover Survey (JOLTS) showed there were more than 10 million job openings in September. Furthermore, the quits rate rose to a record high of 3.4%, reflecting growing confidence workers have in securing new jobs. According to Mickey Levy of Berenberg Securities, “scarce labor amid strong demand has increased wage growth for those switching jobs, which rose 5.4% in September.”2
If this were to signal a further increase in wage pressures, it could finally awaken the bond market vigilantes from their decade-long slumber and cause bond yields to spike.
A version of this article was posted to Forbes.com on November 15, 2021.
1See the CSM report, “Treasuries: Look for 1.8% By Year-End 2022,” October 20, 2021.
2See “JOLTS Report: flows of openings and hires highlight labor market stresses,” November 12, 2021.
Past performance is not indicative of future results. This publication contains the current opinions of Fort Washington Investment Advisors, Inc. Such opinions are subject to change without notice. This publication has been distributed for informational purposes only and should not be considered as investment advice or a recommendation of any particular security, strategy, or investment product. Information and statistics contained herein have been obtained from sources believed to be reliable and are accurate to the best of our knowledge. No part of this publication may be reproduced in any form, or referred to in any other publication, without express written permission of Fort Washington Investment Advisors, Inc.


