Table of Contents
Macro Insights
Closer to CutsStocks delivered another positive month in August, with the S&P 500 rising 2% and bringing the year-to-date gain to nearly 11%. Softer employment data bolstered expectations for a September Fed rate cut, sending front-end yields lower, weakening the dollar, and boosting small caps. The key events in August were the weaker-than-expected July employment report early in the month and Chair Jerome Powell’s dovish remarks at Jackson Hole on August 22. Together, these developments have markets pricing in about a 90% chance of a 25-basis-point cut in September, with at least another 25 basis points expected before year-end. |
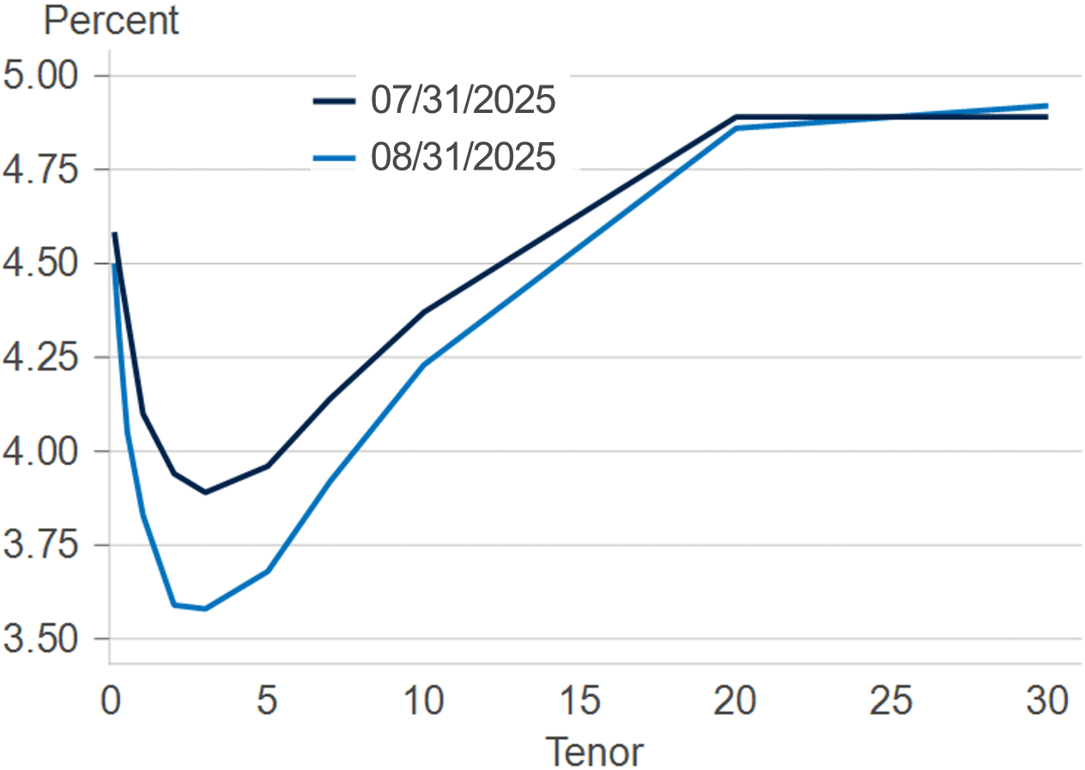
The July employment report disappointed, with an even bigger surprise coming from the materially negative revisions to May and June. The debate now focuses on whether job growth is structurally slowing—posing risks to the current expansion—or whether the past few months reflect only a temporary soft patch linked to tariff uncertainty, now likely to improve as conditions become clearer. We lean toward the latter view, though the ADP jobs release and the official payroll report later this week will provide important signals for market sentiment. Powell’s Jackson Hole speech emphasized that tariffs now present a more balanced set of risks—downside risks to growth and employment offset by upside risks to inflation—implying that policy should shift closer to neutral from its current restrictive stance. Markets responded with a 32-basis-point drop in 2-year Treasury yields, a steepening of the curve, and a 2.2% decline in the U.S. dollar.
Equities showed improved breadth during August, with performance extending beyond the “Magnificent Seven.” While enthusiasm for mega-cap tech remains, some investors have voiced concerns about the narrowness of leadership and market concentration. We explore this topic in greater depth in this month’s Spotlight. The broadening trend included a 7% rally in small caps, fueled by the prospect of lower borrowing costs given their higher leverage and floating-rate exposure. Although aggregate valuations leave less margin of safety, stocks outside of mega-cap tech appear more in line with long-term averages.
Plenty of uncertainty remains as markets debate the outlook: a softer labor picture, unresolved tariff policy and its impact on inflation and margins, the path of Fed policy, and the implications of reduced central bank independence in both the near and long term. We have maintained a largely neutral risk stance, recognizing that the underlying health of consumers and businesses continues to offset these challenges.
Treasury Yield Curve (MoM Change)
The yield curve has steepened over the past month as investors increased their expectations for rate cuts.
What to Watch
The Federal Open Market Committee’s (FOMC) September rate decision and forward guidance will be important for markets. Investors will closely analyze new inflation and employment data that could alter the trajectory of rates. In addition, they will monitor indicators of consumer sentiment and corporate investment to gauge the state of the economy.
|
Monthly Spotlight
U.S. Market Concentration – A Risk or Reflection of Reality
The ten largest companies make up around 40% of the S&P 500’s market capitalization—an all-time high. While headlines around index concentration typically carry a negative tone, is this concentration inherently bad? We believe investors should recognize the underlying dynamics to better understand both the upside and the potential vulnerabilities.
High levels of concentration are not unprecedented. During the dot-com bubble of 1999–2000, the top ten names also commanded a large portion of the U.S. market, peaking at around 25% of the S&P 500. Valuations at the time reflected excitement—companies like Cisco and Pets.com traded at extreme valuations without delivering corresponding profits.

Today’s leaders—the “Magnificent Eight,” which includes Broadcom—generate an outsized share of real economic profits. Their dominance comes from more than just investor enthusiasm: they have strong cash flows, global reach, and durable market positions. While valuations may appear elevated, they are far more grounded than in 2000 and, in our opinion, more closely reflect the economic profit potential of these businesses. Viewed through this lens, the proportion of U.S. market cap represented by the Mag 8 appears reasonably aligned with their share of economic profits.
That said, concentration certainly has implications for investors. With over a third of the S&P 500 tied to the Mag 8, diversification within the index appears more limited relative to history. Investors in the S&P 500 are arguably making an implicit bet on the continued success of these mega-cap technology companies. While the index weight of the Mag 8 has been rising for over a decade as they have grown their share of economic profits, the recent surge has been fueled in part by excitement around artificial intelligence, which has attracted significant investment. This introduces risk to profits if investments in AI fail to produce adequate returns. The impact on the S&P 500 in this scenario could be material. On the other hand, investors need to consider the competitive positions of each of the Mag 8 and their ability to capture economic value if investments in AI do, in fact, pay off.
History also offers perspective: only one of the top ten names from 2000—Microsoft—remains in today’s top tier. Market leadership evolves over time, and today’s concentration reflects the current set of dominant companies. Despite the concentration, we expect several of these companies to remain leaders as long as the barriers to entry protecting their businesses remain in place and assuming we do not experience material overinvestment in AI.
In the end, we view indices such as the S&P 500 or Russell 3000 as reasonably representative of the profit-generation potential of their constituents. While these indices have evolved and become more concentrated, that is not inherently good or bad. We believe focusing on quality companies with barriers to entry and strong returns on capital should be prioritized, rather than expecting index concentration to unwind.
Current Outlook
Market Data & Performance
As of 08/31/2025

Source: Fort Washington and Bloomberg. *Returns longer than 1 year are annualized. Past performance is not indicative of future results.
Download Monthly Market Pulse – September 2025
Download Monthly Market Pulse – September 2025