
This report details how life insurance access and spending vary by location and where families may be most at risk of being underinsured. It also breaks down the basics of life insurance — how it works, how much you might need, and how to choose the right policy for your goals.
A Snapshot of Life Insurance Ownership in America
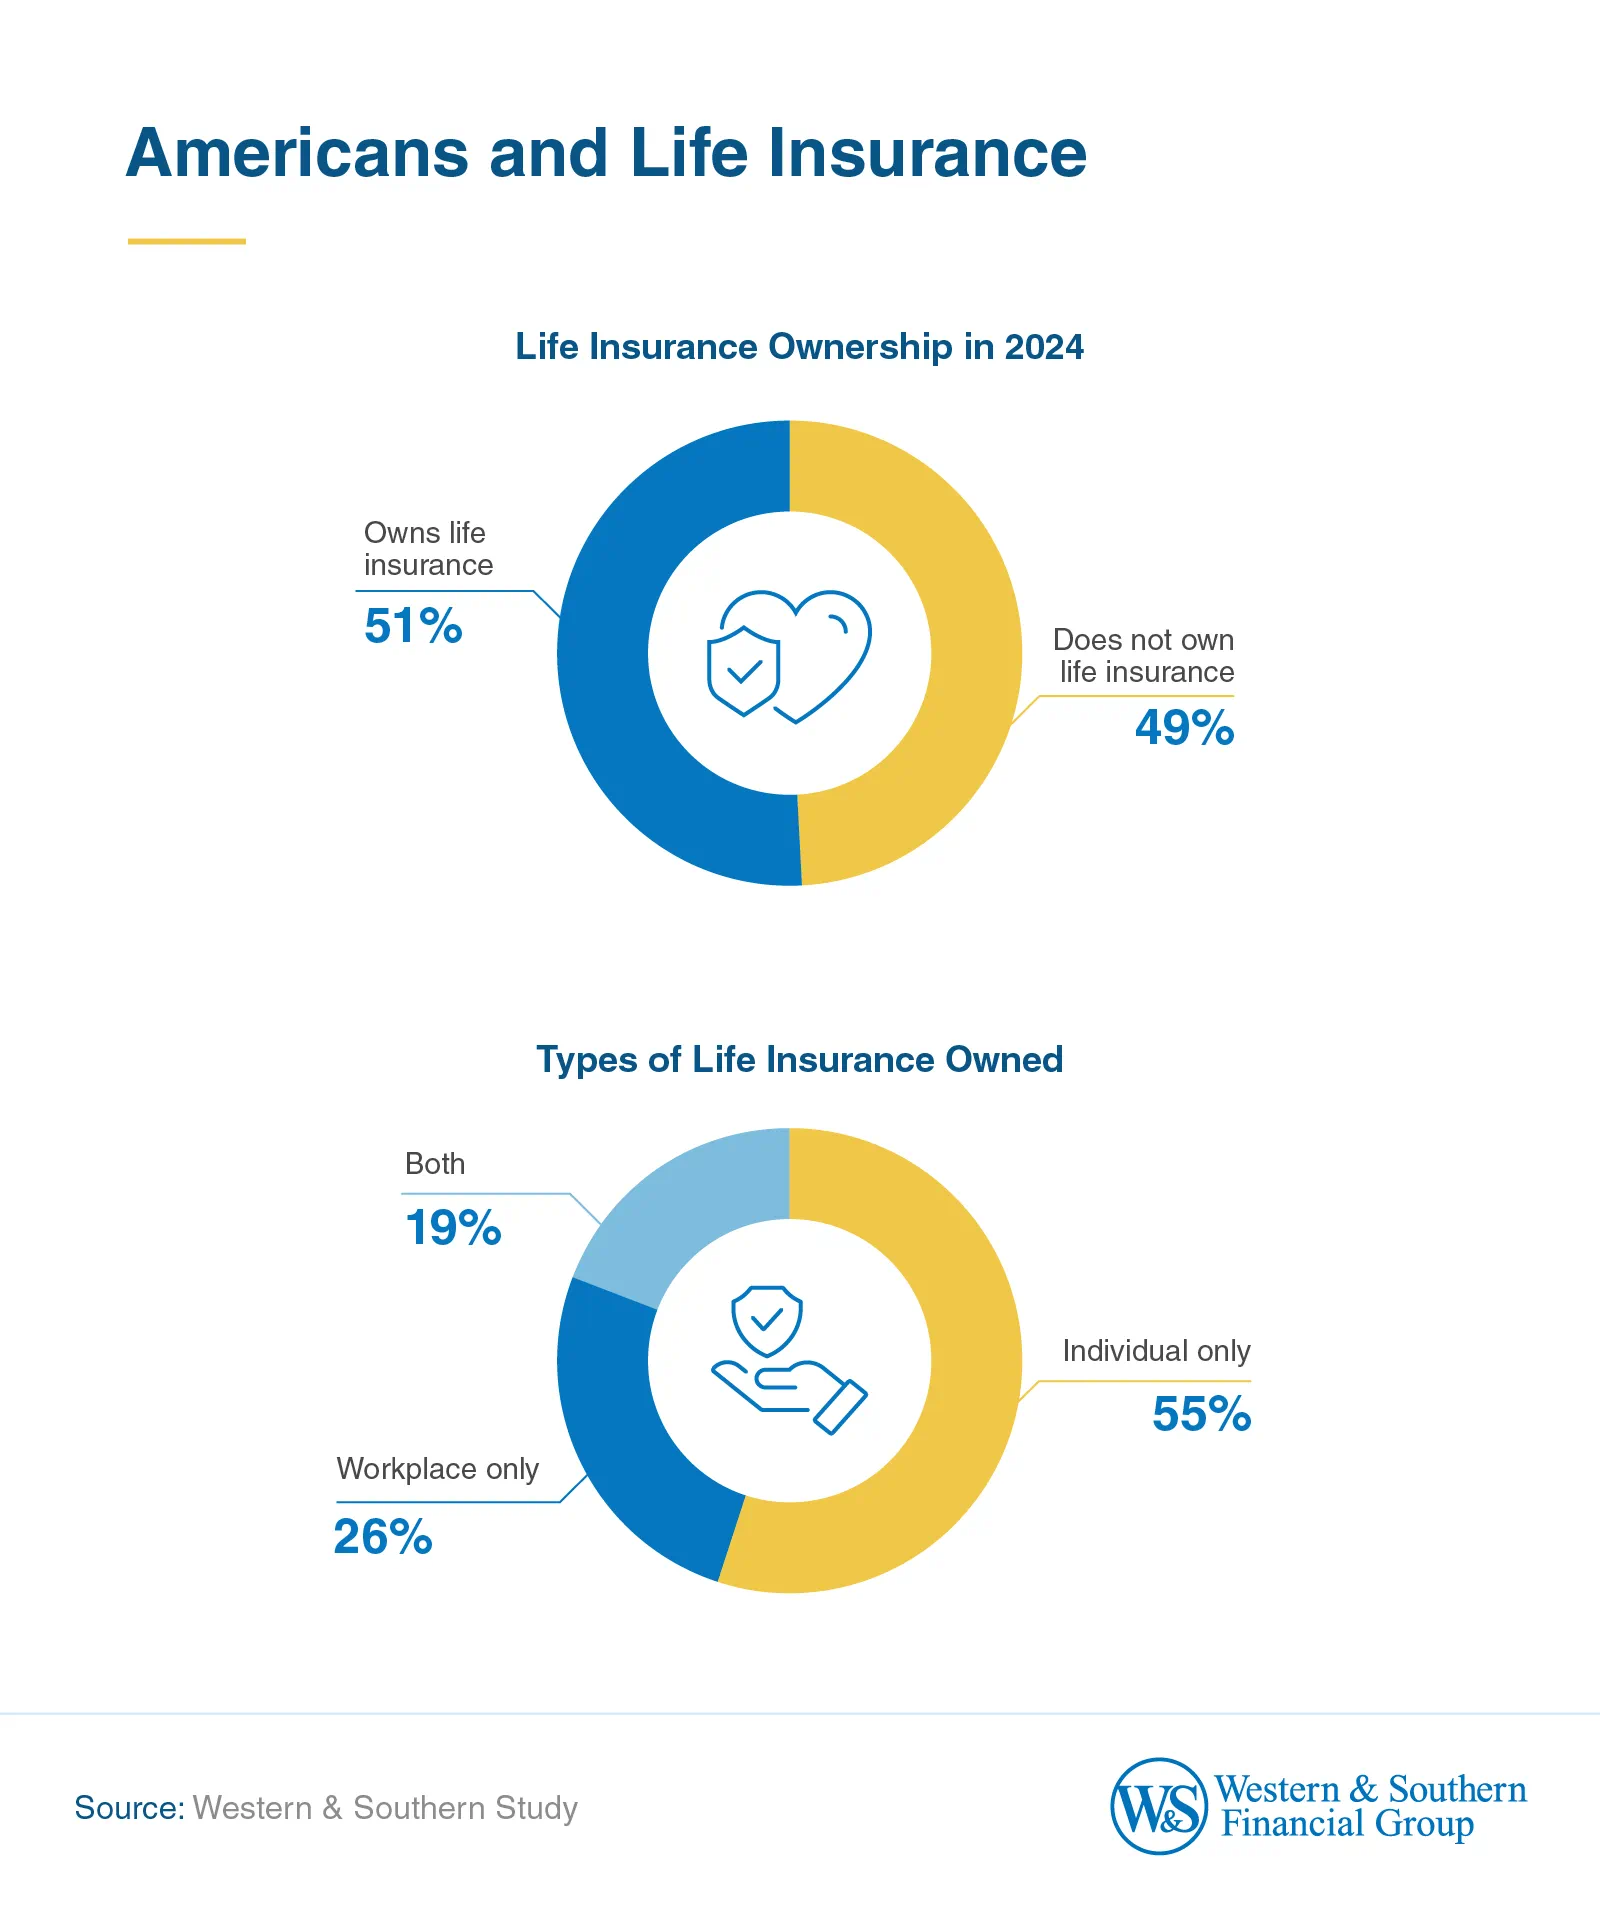
Life insurance coverage in America is uneven, with 51% of adults having some type of policy and 49% having none. More than half of policyholders (55%) have individual coverage only, while 26% have only employer-provided coverage and 19% have both. We also found wide gaps in policy ownership based on age, income, and gender.
Only 36% of Gen Z adults have life insurance, the lowest of any generation. Coverage rates increase with age, with baby boomers having the most at 57%. Overall, men are 24% more likely than women to have a life insurance policy.
Coverage rates also increase with income. Among Americans earning under $50,000 annually, just 31% have life insurance. This jumps to 55% for those earning between $50,000 and $150,000, and 71% for those making $150,000 or more.

Where Life Insurance Premiums Are Highest
In 2023, life insurance spending varied widely by state, both in total dollars and in how much people paid on average. Direct premiums refer to the total amount life insurance companies collect from policyholders before any adjustments like reinsurance.
South Dakota led the nation in spending, with an average of $2,100 in life insurance premiums paid per person. Even with a small population, the state brought in nearly $2 billion in total premiums. Delaware came next at $1,669 per person, followed by Minnesota ($919), Alaska ($859), and New Jersey ($805).

Top 5 States by Direct Premiums Written per Capita
South Dakota
- Direct premiums written per capita: $2,100
- Total direct premiums written: $1,942 million
- Population: 924,669
Delaware
- Direct premiums written per capita: $1,669
- Total direct premiums written: $1,756 million
- Population: 1,051,917
Minnesota
- Direct premiums written per capita: $919
- Total direct premiums written: $5,324 million
- Population: 5,793,151
Alaska
- Direct premiums written per capita: $859
- Total direct premiums written: $636 million
- Population: 740,133
New Jersey
- Direct premiums written per capita: $805
- Total direct premiums written: $7,647 million
- Population: 9,500,851
Residents of Oregon, New Mexico, and Maine spent the least on life insurance. In all three states, premiums were below $370 per person. Idaho and Oklahoma also ranked near the bottom, each with spending under $410.

Bottom 5 States by Direct Premiums Written per Capita
Oregon
- Direct premiums written per capita: $349
- Total direct premiums written: $1,492 million
- Population: 4,272,371
New Mexico
- Direct premiums written per capita: $365
- Total direct premiums written: $778 million
- Population: 2,130,256
Maine
- Direct premiums written per capita: $367
- Total direct premiums written: $516 million Population: 1,405,012
Idaho
- Direct premiums written per capita: $397
- Total direct premiums written: $794 million
- Population: 2,001,619
Oklahoma
- Direct premiums written per capita: $408
- Total direct premiums written: $1,672 million
- Population: 4,095,393
Participation and Payouts: A State-by-State Breakdown
Life insurance coverage varies greatly depending on where Americans live. Some states have nearly one policy in force for every resident, while others have far lower participation.
Alabama has the highest number of life insurance policies per capita, with 0.91 active policies for every resident, followed by Louisiana (0.81), Mississippi (0.68), and South Carolina (0.55). Arizona, Alaska, Washington, and Utah had far fewer policies per capita, each less than 0.25.
Despite large populations and lower mortality rates, California (0.26) and New York (0.34) also have some of the lowest coverage rates in the country. This suggests that even in states with strong economies, many households are underinsured or unprotected.
Having a policy doesn't always mean receiving the same level of protection. For example, in South Dakota, the average death benefit is $230,563, over three times the average in Alabama ($65,688). Utah stood out for having the highest average death benefit ($296,561), followed by Connecticut, Alaska, and New Jersey (each over $280,000).

Top 10 States With the Highest Rates of Life Insurance Coverage
Alabama
- Number of policies in force per capita: 0.91
- Total number of policies in force: 4,712,000
- Average death benefit: $65,688
- Population: 5,157,699
Louisiana
- Number of policies in force per capita: 0.81
- Total number of policies in force: 3,722,000
- Average death benefit: $82,268
- Population: 4,597,740
Mississippi
- Number of policies in force per capita: 0.68
- Total number of policies in force: 1,990,000
- Average death benefit: $84,524
- Population: 2,943,045
South Carolina
- Number of policies in force per capita: 0.55
- Total number of policies in force: 3,021,000
- Average death benefit: $105,841
- Population: 5,478,831
South Dakota
- Number of policies in force per capita: 0.54
- Total number of policies in force: 499,000
- Average death benefit: $230,563
- Population: 924,669
Iowa
- Number of policies in force per capita: 0.52
- Total number of policies in force: 1,682,000
- Average death benefit: $159,760
- Population: 3,241,488
Arkansas
- Number of policies in force per capita: 0.51
- Total number of policies in force: 1,565,000
- Average death benefit: $96,362
- Population: 3,088,354
Nebraska
- Number of policies in force per capita: 0.51
- Total number of policies in force: 1,014,000
- Average death benefit: $172,100
- Population: 2,005,465
Maryland
- Number of policies in force per capita: 0.51
- Total number of policies in force: 3,165,000
- Average death benefit: $142,125
- Population: 6,263,220
North Dakota
- Number of policies in force per capita: 0.50
- Total number of policies in force: 401,000
- Average death benefit: $165,217
- Population: 796,568
Bottom 10 States With the Lowest Rates of Life Insurance Coverage
Arizona
- Number of policies in force per capita: 0.23
- Total number of policies in force: 1,732,000
- Average death benefit: $224,374
- Population: 7,582,384
Alaska
- Number of policies in force per capita: 0.23
- Total number of policies in force: 174,000
- Average death benefit: $285,379
- Population: 740,133
Washington
- Number of policies in force per capita: 0.24
- Total number of policies in force: 1,927,000
- Average death benefit: $231,008
- Population: 7,958,180
Utah
- Number of policies in force per capita: 0.24
- Total number of policies in force: 857,000
- Average death benefit: $296,561
- Population: 3,503,613
Oregon
- Number of policies in force per capita: 0.25
- Total number of policies in force: 1,059,000
- Average death benefit: $196,091
- Population: 4,272,371
Nevada
- Number of policies in force per capita: 0.26
- Total number of policies in force: 842,000
- Average death benefit: $216,172
- Population: 3,267,467
California
- Number of policies in force per capita: 0.26
- Total number of policies in force: 10,283,000
- Average death benefit: $269,815
- Population: 39,431,263
Idaho
- Number of policies in force per capita: 0.29
- Total number of policies in force: 573,000
- Average death benefit: $199,717
- Population: 2,001,619
Maine
- Number of policies in force per capita: 0.31
- Total number of policies in force: 432,000
- Average death benefit: $158,907
- Population: 1,405,012
Rhode Island
- Number of policies in force per capita: 0.31
- Total number of policies in force: 343,000
- Average death benefit: $206,819
- Population: 1,112,308
Do High-Risk States Have Enough Life Insurance?
Some states face higher mortality risks than others, but that doesn't always lead to more life insurance coverage. West Virginia had the highest mortality rate in the U.S. in 2023, with 1,116 deaths per 100,000 residents, but only 0.47 life insurance policies per capita.

Oklahoma also saw more than 1,000 deaths per capita and had even fewer policies at 0.35 per capita. Kentucky and Tennessee ranked high for mortality risk as well, with both states reporting fewer than 0.5 policies.
These gaps point to a disconnect between risk and protection. In states with high death rates and low coverage, families may be especially vulnerable to financial strain. Closing these gaps could help address long-standing insurance needs in underserved communities.
Many of the states with the lowest mortality rates, such as Hawaii, New York, and California, also had low coverage levels. For example, New York has one of the lowest mortality rates in the country and just 0.34 policies per capita. This suggests that low coverage isn't just a high-risk state issue, but a broader challenge that spans across different regions and risk levels.
Top 5 States With the Highest Mortality Rates
Kentucky
- Age-adjusted mortality rate per capita: 1,044
- Number of policies in force per capita: 0.45
Oklahoma
- Age-adjusted mortality rate per capita: 1,026
- Number of policies in force per capita: 0.35
Tennessee
- Age-adjusted mortality rate per capita: 1,009
- Number of policies in force per capita: 0.48
Bottom 5 States With the Lowest Mortality Rates
Hawaii
- Age-adjusted mortality rate per capita: 616
- Number of policies in force per capita: 0.41
New York
- Age-adjusted mortality rate per capita: 665
- Number of policies in force per capita: 0.34
New Jersey
- Age-adjusted mortality rate per capita: 684
- Number of policies in force per capita: 0.36
California
- Age-adjusted mortality rate per capita: 686
- Number of policies in force per capita: 0.26
Massachusetts
- Age-adjusted mortality rate per capita: 694
- Number of policies in force per capita: 0.32
Turning Insights Into Action
This report reveals major differences in how life insurance coverage, spending, and participation stand across the U.S. Some states have strong coverage relative to risk, while others show clear gaps, especially where high mortality rates coincide with low policy counts.
For policymakers, these insights can help identify communities that may benefit from increased outreach or education around insurance access. For insurance professionals, the findings highlight areas where consumers may be underserved or unsure how to get a life insurance policy that fits their needs.
Consumer finance educators and nonprofit leaders can also use this data to better understand where coverage shortfalls exist and how to guide individuals toward long-term protection. Life insurance is often underused in financial strategy, despite its value in helping protect loved ones and meeting future financial obligations.
If you represent an organization, state agency, or educational program interested in using or sharing this research, please get in touch. For more help with understanding your own options, check out our guide below or connect with a Western & Southern representative today.
What Kind of Life Insurance Is Right for You?
Not all life insurance works the same way. Some policies last for a set period, while others are designed to help provide lifetime protection and build retirement savings along the way. Choosing the right policy for you depends on your budget, long-term goals, and how much financial flexibility you need. Here's a quick breakdown:
- Term life insurance offers coverage for a specific number of years, often 10, 20, or 30. It's typically more affordable than permanent options, making it a popular choice for younger families or people with limited budgets.
- Whole life insurance is a type of permanent life insurance that provides lifetime coverage and a guaranteed death benefit. It also builds cash value over time, which policyholders can borrow against or withdraw. However, withdrawals may be subject to charges, and withdrawals of taxable amounts are subject to ordinary income tax.
- If taken before age 59 ½, they may also incur a 10% IRS penalty. Loans accrue interest, may generate an income tax liability, reduce the account value and death benefit, and could cause the policy to lapse. A whole life policy helps offer long-term stability but also comes with higher premiums than term coverage.
- Universal life insurance is another form of permanent insurance, with more flexibility in premium payments and coverage amounts. It may suit those who want both protection and control over how the policy grows.
Understanding the types of life insurance available and the different types of policies offered can help you choose the right solution for your needs today and in the future.
How Much Life Insurance Do You Really Need?
There's no one-size-fits-all answer to how much coverage you need. A good starting point is to consider your income, debts, and the financial needs of your dependents if something were to happen to you. People often buy life insurance to cover mortgages, education costs, and other financial obligations that would otherwise burden their family members.
Some financial experts recommend buying coverage worth 10 to 15 times your annual income. Others suggest basing it on your expenses and future plans. If you're unsure how much life insurance is enough, using a coverage calculator can help guide your decision.
What To Expect When Applying for Life Insurance
The process of getting life insurance typically starts with a short application and a few personal questions. Depending on the policy, you may be asked to complete a medical exam, share details about your medical history, or answer lifestyle-related questions.
After you apply, the insurance company evaluates your health, age, and risk factors through a process called underwriting. Some policies, especially those offering large coverage amounts, may take longer to approve than simplified or no-exam policies. It's also important to review any exclusions in your policy. These are specific conditions or situations where the insurer may not pay the benefit.
If the policy is approved, your coverage begins upon enrollment and payment of your first premium. In most cases, the benefit is paid to your beneficiaries as a lump sum payout, helping them manage immediate costs and maintain financial stability.
Choosing the Right Life Insurance Company
It's important to choose a life insurance company that's financially stable and responsive to your needs. Look for companies with strong credit ratings and a track record of timely claim payments. This indicates strong financial strength and reliability.
You can start by requesting a life insurance quote to compare prices and coverage options. A licensed insurance agent can also walk you through the process and help you get a life insurance policy that fits your goals.
Some insurers offer additional products, such as annuities, which can provide income later in life. If you're planning for retirement as well as protection, ask about bundling options or long-term financial strategy tools.
Life insurance helps offer peace of mind, knowing your loved ones are protected. If you need help getting started, connect with Western & Southern to discuss life insurance options today.
Methodology
This report analyzes life insurance participation across all 50 U.S. states to identify where financial protection aligns or fails to align with real-world needs. It combines data from trusted sources in the insurance and public health sectors to create a comprehensive picture of coverage trends, regional disparities, and potential underinsurance risks.
This study focuses on:
- Life insurance participation levels, measured by the number of policies in force per capita and average death benefit by state.
- Spending patterns, reflected in per capita direct premiums written.
- Mortality risk, assessed using age-adjusted mortality rates to account for differences in state population age structures.
Data points were standardized to ensure comparability across datasets and aligned with 2023–2024 reporting periods, unless otherwise specified.
Data Sources
- Life insurers direct premiums written by state, 2023: Insurance Information Institute (III.org)
- Population: U.S. Census Bureau
- Life insurance ownership by demographics: Western & Southern 2024 Insurance Barometer Study Report
- Life insurance participation and average death benefit by state: American Council of Life Insurers (ACLI) 2024 Factbook
- Mortality risk: CDC WONDER, Underlying Cause of Death, 2018–2023
About Western & Southern
Founded in Cincinnati in 1888 as The Western and Southern Life Insurance Company, Western & Southern Financial Group, Inc., a Fortune 500® company at No. 284, is the parent company of a group of diversified financial services businesses. Its assets owned ($80 billion) and managed ($42 billion) totaled $122 billion as of Sept. 30, 2024.1 Western & Southern is one of the strongest life insurance groups in the world. Its seven life insurance subsidiaries (The Western and Southern Life Insurance Company, Western-Southern Life Assurance Company, Columbus Life Insurance Company, Gerber Life Insurance Company,2 Integrity Life Insurance Company, The Lafayette Life Insurance Company, and National Integrity Life Insurance Company) maintain very strong financial ratings. Other member companies include Eagle Realty Group, LLC; Fabric by Gerber Life; Fort Washington Investment Advisors, Inc.;3 Gerber Life Agency;4 IFS Financial Services, Inc.; Touchstone Advisors, Inc.;3 Touchstone Securities, Inc.;5 W&S Brokerage Services, Inc.;3,5 and W&S Financial Group Distributors, Inc.6 Western & Southern is a title sponsor of several major community events every year. From 2002 to 2023, it served as title sponsor of Cincinnati's longtime professional tennis tournament — now named the Cincinnati Open — an ATP Masters 1000 and WTA 1000 event and one of the world's largest tournaments. The company continues to serve as a major sponsor of the event.
1 The financial information presented here is preliminary and unaudited.
2 Gerber Life is a registered trademark. Used under license from Société des Produits Nestlé S.A. and Gerber Products Company.
3 A registered investment advisor.
4 In the State of California, Gerber Life Agency, LLC is known as and does business as Gerber Life Insurance Agency, LLC.
5 A registered broker-dealer and member FINRA / SIPC.
6 W&S Financial Group Distributors, Inc. (doing business as W&S Financial Insurance Services in CA).
Review our current financial ratings.
From Fortune ©2024 Fortune Media IP Limited. All rights reserved. Used under license. Fortune and Fortune 500 are registered trademarks of Fortune Media IP Limited and are used under license. Fortune and Fortune Media IP Limited are not affiliated with, and do not endorse the products or services of Western & Southern Financial Group.
Fair Use Statement
Sharing these findings for noncommercial purposes is allowed with a proper link back to this page.